Indonesian Coal Consumption Levels And The Comparative Low Emission Levels Generated By Coal From A National And Global Outlook.
Until today, the general public, I believe, harbours the view that coal is black and dirty causing a lot of emission gases and polluting the air in Indonesia severely.
With regard to the amount of emissions produced by hydro-carbon fuel in Indonesia a recent study by Manfred Kleemann in 1994 gave the following Table 5.
Table 5 indicates that above view is not quite correct.
Table 5
Polluting Emission from the Use of Energy (1993) (T)
Type of
Energy |
Consumption
(1000T) |
Emission
CO2 |
Emission
SO2 |
Emission
NOx |
Emission
SPM |
Emission
VHC |
Coal
Oil
Natural Gas
Hydro
Geothermal
Biomass |
8,410
37,808
9,998
171,428 |
17,490,0
118,720.0
26,200.0
0.0
0.0
217,716.1
380,126.1 |
54.39
300.94
0.01
0.0
0.0
25.10
377.44 |
49.44
155.69
10.38
0.0
0.0
125.48
340.99 |
7.93
9.94
0.0
0.0
0.0
1,505.76
1,523.63 |
0.39
206.00
1.00
0.0
0.0
250.96
458.35 |
The real "culprits" who are polluting the Indonesian air in large amounts today are in fact oil and biomass. The emission contribution of coal is quite insignificant compared to the emissions produced by both earlier mentioned hydro-carbon fuels.
Basically, gaseous emissions produced by hydrocarbon fuels for instance depend on two parameters; the content of the polluting elements inherent in the fuel and the volumes or amounts involved in the burning process.
Indonesia which is world wide known for its relatively low-S coal (less than 1%) consumed in 1995 about 11.5 million T (in average medium grade) coal for its CFPPs, cement - plants and small industrial plants.
Converted to tonnes oil equivalent (toe) this is comparable to 6.7 million toe (estimate by the writer). The world at large in 1995 consumes 2,210.7 million toe. (BP Statistical Review 1996) which means that Indonesia in 1995 consumes and burns only 0.3% of the world¹s total.
With an estimated increase of 2,1%* of world coal consumption p.a, world coal consumption in 2000 may reach 2,431.77 million toe and Indonesia's share with an estimated 21 million toe (35 million T) in 2000, will amount to 0.86% of total world coal consumption.
CO2 one of the significant emission gases, represents 50% of all greenhouse gases worldwide as shown in figure attached.
Contribution of CO2 emission from coal combustion / burning worldwide is about 17% of total greenhouse gases with coal fired power plants responsible about half or 8%.
With a coal consumption of ± 11,5 million T in 1995, Indonesi's contribution of C02 emission from the use of coal amounts to.
(6.7 / 2210.7 ) x 17% = 0.05%
Production
(Million T Coal) |
Consuption
(Million TOE) |
| Contry |
Hard Coal | Lignite | All ranks of coal | Share of total |
China
USA
India
Russian
Federation |
1,253.4
577
263
170.5 |
446
357
22
917 |
640.3
494.4
128.3
917 |
29%
22.4%
5.8%
5.4% |
| Total | 2,263.9 | 515.3 | 1,382.4 |
62.6% |
Source: BP Statistical Review 1996
Best Estimate of warning to 2100 given in IPCC reports
| Report | Warning | % of IPCC 1990 |
1990
1992
1995 |
3.2o
2.5o
2.15o |
100
78
67 |
In year 2000, when coal consumption will reach an estimated 35 MT, Indonesia's contribution to greenhouse gases from coal will reach:
( 6.7 / 2431.77 ) x 17 % = 0.147%
a minuscule amount compared to total worldwide 2431.77 greenhouse emissions.
The Latest Findings about C02 Emisson's Impact on Global Warming
This author had, in a former paper presented in 1991 at the Indonesian Mining. The Decade of Take-Off Conference, held in Jakarta claimed the fact that among scientists, the issue of CO2's adverse impact or the intensity of impact on global warming is far from settled.
Debate concerning this matter continue over the years resulting in revelations which are really surprising.
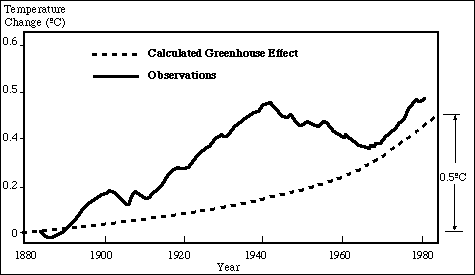
A publication circulated at the 8th Session of the UN, Negotiating Committee on Climate Change in 1993 shows the following Figure 1.
 Although computer simulated greenhouse effect on global warming (dashed lines) shows a rise of 0.5° in the last 100 years, which is in accordance with the actual measurements of the average temperature on the earth surface (solid line), a closer look reveals that this 0,5° rise has occurred before 1940.
This is a strange phenomenon since historically most of the CO2-an estimated 70%-entered the atmosphere after 1940 i.e. since World War II when as result of the post war reconstruction boom the world at large entered a period of strong economic growth. a.o. fueled by the finding of the massive oil reserves around the Persian Gulf area.
However starting from 1940 and ending around 1970 a fall in temperature has been noticed which is difficult to explain. At that point of time the UN Intergovernmental Panel on Climate Change (IPCC) stated:
It is still not possible to attribute any or all of the warming of the last century to greenhouse gas induced climate change.
In the period of 1990 to 1995, IPCC made three different assessments regarding global warming showing a successively declining trend of the global warning estimates, to 2100. This proves that the first assessment made in 1990 showing a best estimate of global warning basing on computer models to the year 2100 of 3,2°C was grossly exaggerated. Using new models in 1992, the best estimate warming to the year 2100 was reduced to 2,5° (78% of the 1990 value). The reasons according to IPCC sources were changes in policy and population.
This new updated Assessment was specifically created for the 1992 Earth Summit in Rio de Janeiro. Quoting Dr. P. Michaels (Professor of Environmental Sciences, University of Virginia): It is now generally accepted that the models that based the 1992 treaty were grossly in error, predicting between three and four times as much global warning as had occurred..........It seem inescapable that this error was known by the IPCC at the time the treaty was signed².
There was also a statement that manmade sulfate aerosols might lead to significant regional cooling. Indeed the most recent findings by Robert Charlson and associates and reported in ECOAL of July 1996, stated that sulphate aerosols formed from emissions of sulphur dioxide could have a cooling effect in the climate. This however has still to be tested.
In 1995 IPCC again reduced the predicted warming to 2100 to a little over 2°C (2.15°C) or 67% of the 1990 value.
Citing Dr. Michaels again: ³The climate model estimate that best track the past only projects 1.3°C of warming until 2100 which is a reduction of 60% from the 1990 value and 50% from 1992.
Measurement Using Weather Balloons and NASA Satellites
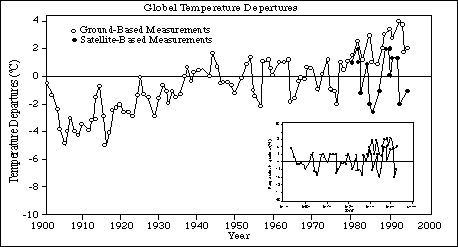
Data from the landbased network of weather balloons have revealed that there is a statistical significant warning of 0,5° over the last century as the following Figure 2. When focusing on the last 50 years and using the measurements on the earth-surface there is a global trend of a ± 0.3°C increase over the whole period.
However, when satellite data are incorporated ( see the black spots ) after they become available in 1979, the warming over the last 50 years is further reduced to practically zero. In fact, there is no significant warming in the combined surface‹ satellite record of global temperature since 1943.
This is certainly a surprising revelation in view of the fact that the massive increases in greenhouse gases should have started since World War II.
It is clear that we need more time to understand the fundamentals regarding greenhouse emisison and its effect on global warming.
References
- Achmad Prijono, Clean Coal Technology and Its Role in the Development of the Coal Industry: the Indonesian Case, December 1991.
- Achmad Prijono, Indonesia's Economic Development Objectives and the Implications Towards Application of Clean Coal Technology, October 1994.
- BP Statistical Review of World Energy 1996.
- ECOAL 13 A (Special Newssheet by World Coal Institute, 1993).
- ECOAL Volume 18, July 1996.
- Kodyat Samadikun (PLN), Demand for Coal in the Indonesian Power Development Plan, an update, September 1995.
- Patrick Michaels, Dr., A World Without Coal the Alternative Perspective.
- Manfred Kleeman, Energy Use and Air Pollution in Indonesia, 1994.
- Shells Briefing Service No. 1, 1991.
- Sudjoko Tirtosoekotjo, Boni Siahaan, Coal and National Electricity Development Policy Opportunities and Challenges, 1995.
- Toohey, Coal: The Road Ahead, Issues and Challenges, CoalTrans 1996.
- Zuhal, Ketenagaan Listrik Indonesia, April 1995.
Achmad Prijono
[Sajian Utama]
[Sajian Khusus]
[Profil Elektro]
[KOMPUTER]
[TELEKOMUNIKASI]
[KENDALI]
[ELEKTRONIKA]
[INSTRUMENTASI]
[PII NEWS]
Please send comments, suggestions, and criticisms about ELEKTRO INDONESIA.
Click here to send me email.
[Edisi Sebelumnya]
© 1997 ELEKTRO ONLINE and INDOSAT NET.
All Rights Reserved.
 Although computer simulated greenhouse effect on global warming (dashed lines) shows a rise of 0.5° in the last 100 years, which is in accordance with the actual measurements of the average temperature on the earth surface (solid line), a closer look reveals that this 0,5° rise has occurred before 1940.