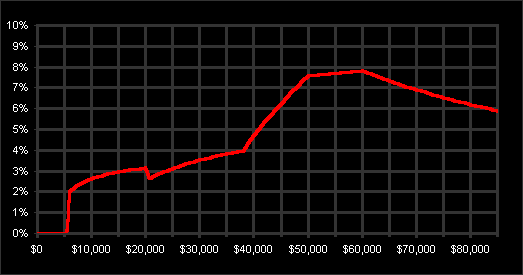
Percentage increase in take home
pay as a function of gross income.
e.g. if you earn $20,000
a year, your take home pay will go up by just over 3%.
| The graphs below show that the GST
income tax cuts are extremely regressive.
In dollar terms, those on smaller incomes get the least benefit. In even in percentage terms, those on small incomes are among the hardest hit. (Those on quite large incomes lose in percentage terms, but this is from a large base.) |
The graphs below reveal all.
CASE 2: Inflation
of 6.5%
Let's be conservative and say the GST
makes things go up by 6.5%. Who's take home pay goes up by less than 6.5%
due to tax cuts? Everyone earning less than $45,819 or earning more than
$75,795.
So everyone earning less than $45,819
is worse off under the new tax system, and the less you earn the more worse
off you are. Just look at the graph and see that the percentage
increase in your take home pay is smaller the less you earn. So the new
tax system is incredibly regressive.
CASE 3: Inflation
of 3.5%
Let's say by some miracle inflation
is only 3.5%. Who is worse off then?
Everyone earning less than $29,422
or more than $155,960. Once again, those earning less are the hardest hit.
(Anyone earning $150,000 can obviously afford a smaller tax cut.)

Percentage increase in take home
pay as a function of gross income.
e.g. if you earn $20,000
a year, your take home pay will go up by just over 3%.
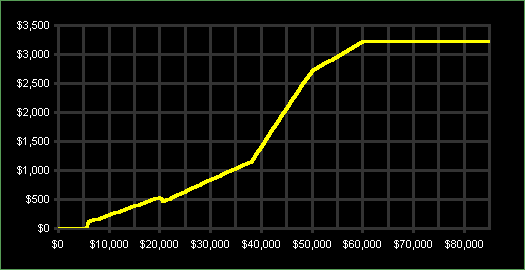
Everyone else has to make do with less, and the less you earn, the fewer dollars you get.
Anyone earning over $60,000 gets an extra $3222 every year.
To get an extra $3000 you need to earn
$55,560
To get an extra $2000 you need to earn
$44,446.15
To get an extra $1000 you need to earn
$33,950
