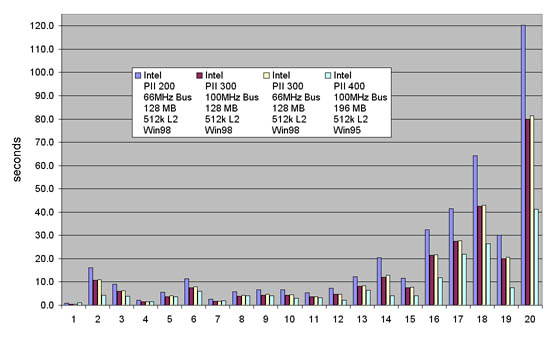
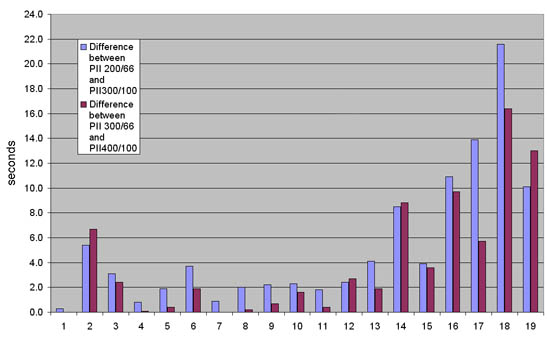
These tables and graphs compare the deviation over 100MHz
between the PII200 to PII300 and PII300 to PII400. The
table and graphs show that the PII400 should have performed
better. The improvement from 200MHz to 300MHz was greater
than the improvement from 300MHz to 400MHz.
note: the PII200MHz was simulated by running a PII300 at 200MHz
| Intel PII 300 66MHz Bus 128 MB 512k L2 Win98 |
Intel PII 400 100MHz Bus 196 MB 512k L2 Win95 |
Difference between PII 300/66 and PII400/100 |
| 0.5 | 1.0 | -0.5 |
| 10.9 | 4.2 | 6.7 |
| 6.2 | 3.8 | 2.4 |
| 1.5 | 1.4 | 0.1 |
| 4.0 | 3.6 | 0.4 |
| 7.9 | 6.0 | 1.9 |
| 1.8 | 2.0 | -0.2 |
| 4.2 | 4.0 | 0.2 |
| 4.8 | 4.1 | 0.7 |
| 4.5 | 2.9 | 1.6 |
| 3.6 | 3.2 | 0.4 |
| 4.8 | 2.1 | 2.7 |
| 8.3 | 6.4 | 1.9 |
| 12.9 | 4.1 | 8.8 |
| 7.7 | 4.1 | 3.6 |
| 21.6 | 11.9 | 9.7 |
| 27.7 | 22.0 | 5.7 |
| 42.9 | 26.5 | 16.4 |
| 20.6 | 7.6 | 13.0 |
| 81.4 | 41.2 | 40.2 |
| 277.8 | 162.1 | 115.7 |
| Intel PII 200 66MHz Bus 128 MB 512k L2 Win98 |
Intel PII 300 100MHz Bus 128 MB 512k L2 Win98 |
Difference between PII 200/66 and PII300/100 |
|
| Rotate 90 | 0.8 | 0.5 | 0.3 |
| Rotate 9 | 16.1 | 10.7 | 5.4 |
| Rotate .9 | 9.1 | 6.0 | 3.1 |
| Gaussian Blur 1 | 2.2 | 1.4 | 0.8 |
| Gaussian Blur 3.7 | 5.6 | 3.7 | 1.9 |
| Gaussian Blur 85 | 11.3 | 7.6 | 3.7 |
| Unsharp 50/1/0 | 2.6 | 1.7 | 0.9 |
| Unsharp 50/3/7/0 | 5.9 | 3.9 | 2.0 |
| Unsharp 50/10/5 | 6.6 | 4.4 | 2.2 |
| Despeckle | 6.7 | 4.4 | 2.3 |
| RGB-CMYK | 5.4 | 3.6 | 1.8 |
| Reduce Size 60% | 7.2 | 4.8 | 2.4 |
| Lens Flare | 12.2 | 8.1 | 4.1 |
| Color Halftone | 20.5 | 12.0 | 8.5 |
| NTSC Colors | 11.5 | 7.6 | 3.9 |
| Accented Edges | 32.4 | 21.5 | 10.9 |
| Pointillize | 41.4 | 27.5 | 13.9 |
| Water Color | 64.2 | 42.6 | 21.6 |
| Polar Coordinates | 30.1 | 20.0 | 10.1 |
| Radial Blur | 120.2 | 80.0 | 40.2 |
| PS4Bench Index | 412.0 | 272.0 | 140.0 |
Click here to enlarge graph.

Click here to enlarge graph.


|
| LinkExchange Member | Free Home Pages at GeoCities |