|
What is El Niņo?
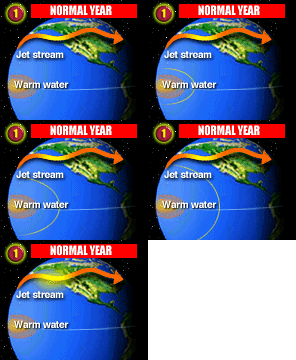
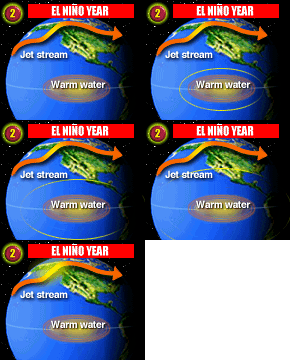
The term "El Niņo" is really shorthand for what weather forecasters and scientists call the "El Niņo-Southern Oscillation" or ENSO. It is not a "warm current in the Pacific," although the name originally referred to a warm ocean current fishermen off the coast of Peru noticed in December. Some years it would be stronger than others. In Spanish "El Niņo" means the "boy child," or the infant Jesus. The warm water was given the name because it shows up off Peru around Christmas. In the last few years, the term La Nina, the girl, has been used to refer to the times when the water of the tropical Pacific is colder than normal. Today's use however is much wider than that. The "Southern Oscillation" part of the name comes from observations made by a British scientist, Gilbert Walker, in the early 1900s. He discovered that when atmospheric pressure is low around Australia, it's high to the east at Tahiti. When the pressure is high in Australia, it's low in Tahiti. This see-sawing of air pressure is the Southern Oscillation. Here's how it and the El Niņo current are linked: During non-El Niņo, times, the Earth's warmest ocean water is in a huge pool in the western Pacific East-to-west trade winds push water heated by the tropical sun westward, piling it up around Indonesia and other places west of the International Date Line. From time to time - the reasons aren't clear - the trade winds weaken and the warm water sloshes eastward across the Pacific to South America. When the warm water reaches the South American Coast it spreads north and south along the coast, creating the warmer than usual "El Niņo" along the coast of Peru. A key indicator that an El Niņo is beginning or going on is unusually warm ocean temperatures along and on both sides of the equator in the central and eastern Pacific. If this were all that there is too it, an ENSO would affect only the tropical Pacific ocean. But what happens to oceans also affects the atmosphere. Tropical thunderstorms are fueled by hot, humid air over the oceans. The hotter the air, the stronger and bigger the thunderstorms. As the Pacific's warmest water spreads eastward, the biggest thunderstorms move with it. These thunderstorms pump warm air and humidity more than 50,000 feet into the air. This represents a lot of energy and affects high-altitude jet stream winds. Imagine jet streams as being something like white water rivers with the water swirling and making waves as it flows over rocks. An El Niņo is like moving the rocks, changing the locations and sizes of the resulting waves. The wind speeds and locations of jet stream waves establish patterns of stormy and fair, wet and dry weather far downstream. In fact, changes in jet stream winds caused by an ENSO affect the weather not only in North and South America, but as far away as Africa.
  Disruption begins in thePacific
What El Niņo is doing, could do In the Pacific Ocean tropics El Niņo is the major player in determining what the weather is like. Elsewhere in the world, it's only one of many patterns that affect the weather. This is why forecasting what El Niņo will do in particular areas is difficult.
northern Illinois and Indiana along western Michigan and the upper penninsula of Michigan west central Minnesota, southeast North Dakota, and northeast South Dakota eastern edges of Lakes Erie and Ontario
While there appears to be some impact of El Niņo on the climate in the Midwestern, a wide spectrum of climate conditions have occurred during past events. This illustrates that there are other factors influencing our climate, perhaps the most important is the natural variability of the climate system.
|
||||||||||||||||||||||||||||||||||||||||||||||||||||||||||||||||||||||||||||||||||||||||||||||||||||||||||||||||||||||||||||||||||||||||||||||||||||||||||||||||||||||||||||||||||||||||||||||||||||||||||||||||||||||||||||||