The Colorimetric Analysis of Nitrates and Phosphates in Surface Ponds and Streams by Waterose
Index: Tables and Figures: Table 1. Nitrates in Water Samples. Table 2. Phosphates in Water Samples. Table 3. pH, Conductivity, Nitrates, Phosphates. Figure 1. Concentration of Nitrates in Water Samples. Figure 2. Concentration of Total Phosphates in Water Samples and Standard Solutions. Figure 3. Concentration of Total Phosphates in Water Samples. The presence of nitrate and phosphate ions in surface stream water may originate from natural or anthropogenic sources. The detection of these ions is completed by the addition of reagents to the samples and to standard solutions which forms a coloured complex with the ions of interest. The amount of coloured complex is analyzed by colorimetric analysis on an absorbance spectrophotometric machine to interpolate the amount of ion species in the water sample. The water samples analyzed in the stream in the Japanese Gardens at Royal Roads University had high nitrate concentrations between 11.0 mg/L and 15.0 mg/L. The high concentrations may be attributed to a combination of natural and anthropogenic sources. The water samples had low phosphate concentrations between 0.04 mg/L and 0.18 mg/L. The presence of phosphate ions may be attributed to natural sources. There was no observable trend in concentrations of nitrates and phosphates relative to the location of sampling sites. There are suggested relationships between the concentrations of nitrates and phosphates relative to the pH and the conductivity. Water samples that were more acidic had higher concentrations of nitrates and phosphates. Conversely, water samples that had higher conductivity readings had lower concentrations of nitrates and phosphates. Key Words: surface stream water colourimetric analysis, nitrates, total phosphates, pH, conductivity The presence of nitrates and phosphates in surface streams occurs from natural sources and anthropogenic sources. Nitrates enter surface streams from natural sources of decaying biomass (Manahan 1994), and from anthropogenic sources of sewage, fertilizers, and industrial waste (ibid). Phosphates enter surface streams from natural sources of decaying biomass and weathering of soluble inorganic minerals (ibid), and from anthropogenic sources of fertilizers, domestic waste water containing phosphate detergents (ibid). Naturally occurring levels of nitrates and phosphates are not harmful to the environment or to human health. Conversely, excessive amounts of nitrates and phosphates in surface water can lead to eutrophication, a condition of superfluous algal growth that reduces the amount of free oxygen in the water which is harmful to the environment (ibid). Excessive amounts of nitrates in drinking water can cause methemoglobinemia in infants or similarly, anemia in cattle; a condition that exists when the haemoglobin in the blood cannot transport oxygen effectively (ibid). Excessive amounts of nitrates and phosphates in surface waters can be harmful to the environment, hence it is important to monitor and measure the amounts of these substances in surface waters. All materials and methods used are as described in the Environmental Science Lab Manual, 1997 for Experiment 5. Water samples were collected from the creek in the Japanese Garden at Royal Roads for analysis of nitrates and phosphates. Sample collection methodology and field observations are described in the field notes section. Standards were prepared and the concentration of nitrates and phosphates in the stand solutions and the sample solutions was measured by absorbance on a spectrophotometric machine. Additions to the methods include pH tests as described in the Environmental Science Lab Manual, 1977, Appendix IV, and conductivity tests. The conductivity tests on the water samples were completed by obtaining a sub-sample of the water sample. The probe was rinsed with de-ionized water and then placed into the sub-sample of stream water and recording the conductivity with an electrochemical meter. Field Notes: The water samples were collected at three different locations in the Japanese Garden at Royal Roads University (Appendix I Map). The samples were collected between 10:00 a.m. and 11:00 am. The weather conditions were cool with air temperatures of approximately 15° C. The sky was overcast; however, it was not raining. At each sample site location, the sample bottle was immersed and filled with stream water which was poured out downstream of the collection site. The bottles were rinsed three times with stream water at the site prior to collecting the sample. The bottle cap was rinsed three times before capping the sample bottle. Each bottle was filled to overflowing, the cap was then filled with stream water, and then inverted over the sample bottle to minimize air bubbles in the sample bottle. This procedure was used at each site location. Sample 1 was collected north of the large ponds above the water wheel. The creek was approximately 1.5 feet wide and .5 feet deep. The water was clear and running fast. There was no visible disturbances or siltation to this sampling location. There was extensive shrubs and herbaceous plants beside the sampling site; however, there was no visible plant debris in the creek at this sample location. Sample 2 was collected south of the three ponds, north of the road, from a concrete stream channel. The creek channel was approximately 1 foot wide and 1 foot deep. The water was clear and running fast. There were sparsely spaced large trees north of the sampling site which was primarily in a grassy field area. Sample 3 was collected between the uppermost north pond (first pond) and the second pond located immediately south of the uppermost north pond. The sample was collected from a concrete stream channel. The creek channel was approximately 1 foot wide and 1 foot deep. The water was clear and running fast. The concrete channel was covered with green flora on the bottom and green flora on the sides. There was extensive shrubs and herbaceous plants beside the sampling site and overhanging the sampling site; however, there was no visible plant debris in the creek at this sample location. The samples were stored at room temperature from 11:00 am until 2:00 PM. The temperature of the samples may have increased between the time of sampling and the time of experimentation. The chain of custody form is attached in Appendix II. Nitrates: The results of the absorbance analysis of the samples and the standards are summarized in Table 1. The concentration of nitrates in the stream were between 11.0 mg/L and 14.7 mg/L with no visible trend relative to site location. The concentration of nitrogen(N):nitrates(NO3-) in the stream samples were between 2.49 mg/L and 3.32 mg/L with no visible trend relative to site location. Table 1. Nitrates in Water Samples.
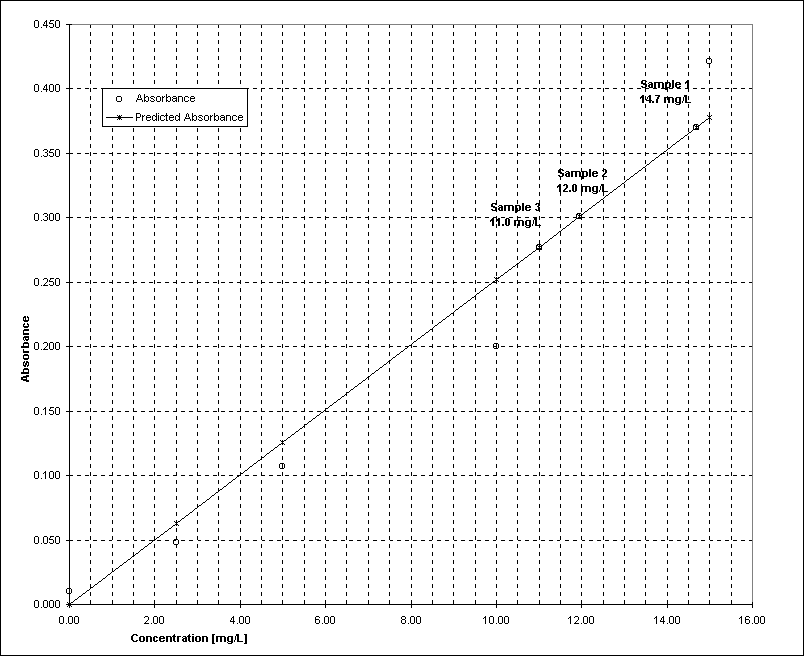
Calculations: The calculations to determine the concentration of nitrate and nitrogen:nitrates were completed in several steps. A regression analysis was performed on the linear model of the reading relating to the standards to obtain the y = mx + b linear formula. The value of x, the slope, was 0.025178947 and the value of b, the intercept was 0. This linear equation was used to calculate the nitrate concentration of the samples. The concentration of nitrates in the standards and the water samples are plotted in Figure 1. The sample calculation is as follows for Sample 1. Sample 1 Nitrate Concentration Calculation:
The calculation of N:NO3- is calculated using the molar mass of the N relative to the molar mass of the NO3-. The molar mass of N is 14.0067 and the molar mass of NO3- is 62.0049, so the calculation of N:NO3- for Sample 1 is: Sample 1 N:NO3- Concentration Calculation:
The average expected level of nitrate concentration in surface stream waters varies regionally. The maximum allowable nitrate concentration under the national drinking water standards is 8-10 mg/L (Sigmund 1996). The high nitrate concentrations in the water samples may be due to a combination of natural sources and anthropogenic sources. The thick flora coverage of the garden and the decaying biomass, common to the fall season, is a natural contributor to the nitrate in the stream. In addition, the source of the stream north of Royal Roads is urban, and there may be anthropogenic additions that would significantly increase the amounts of nitrates in the surface waters; potential additives from municipal sewage, industrial wastes and garden fertilizers. Figure 1. Concentration of Nitrates in Water Samples.
Phosphates: The results of the absorbance analysis of the samples and the standards are summarized in Table 2. The concentration of total phosphates in the stream were between 0.18 mg/L and 0.04 mg/L with no visible trend relative to site location. The concentration of phosphates in the stream samples are: Table 2. Phosphates in Water Samples.
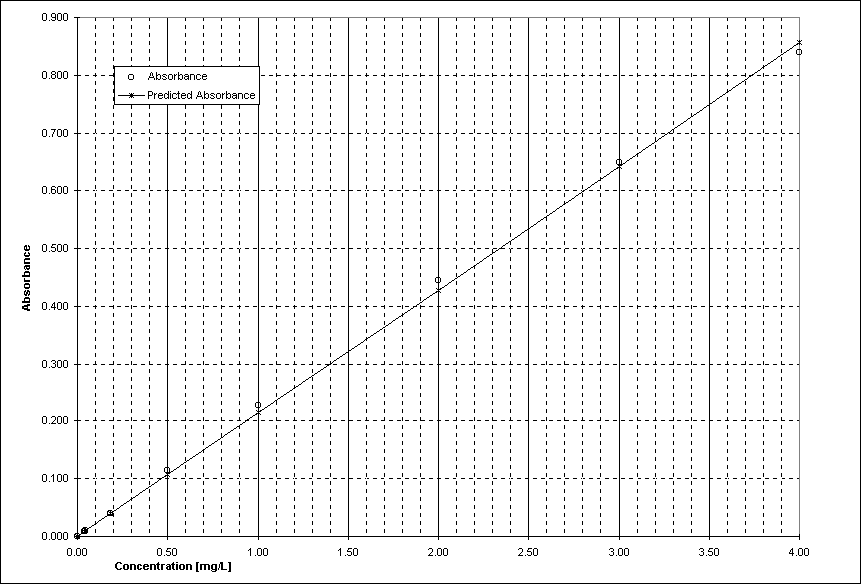
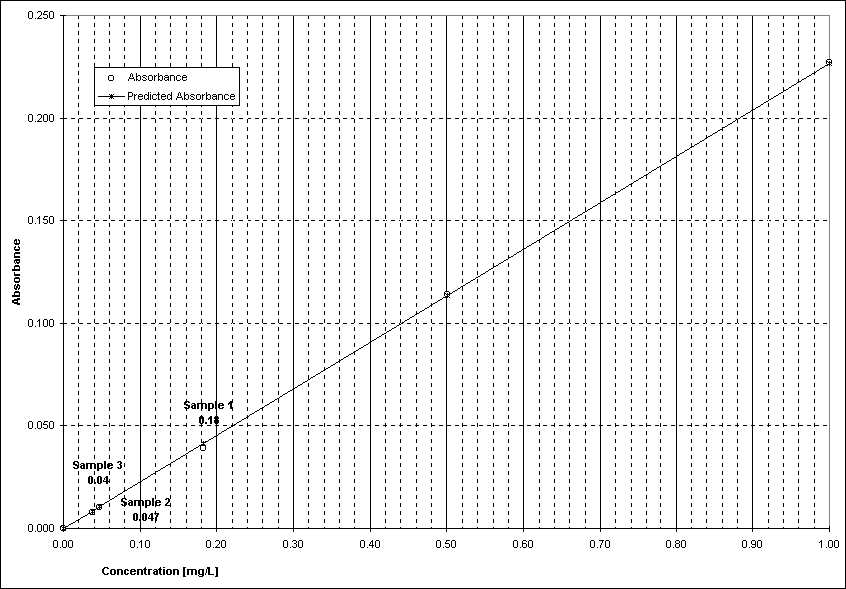
Calculations: The calculations to determine the concentration of total phosphates were completed using the same methods as described to calculate the concentration of nitrate. A regression analysis was performed on the linear model of the reading relating to the standards to obtain the y = mx + b linear formula. The value of x, the slope, was 0.214115702 and the value of b, the intercept was 0. This linear equation was used to calculate the phosphate concentration in the samples. The concentration of phosphates in the standards and the water samples are plotted in Figure 2. The concentration of phosphates in the water samples only are plotted on Figure 3. It is important to note that the minimal absorbance readings limited the significant figures to one or two digits; the experiment was approaching the precision limits of the absorbance spectrophotometer. The low phosphate levels may be attributed to naturally occurring phosphates in the environment such as decaying biomass and weathering of soluble phosphates in minerals. The expected level of phosphate concentration in surface stream waters is less than 0.1 mg/L (Sigmund 1996). There are not significant anthropogenic contributions of phosphates to the stream because of phosphate substitutes in household cleaning products that may enter the stream from north of the sampled sites. It is possible that phosphate containing fertilizers used in gardens leaching into the water table upstream may contribute abnormal amounts of phosphates; however, the phosphate concentrations in the water samples were below expected levels. Figure 2. Concentration of Total Phosphates in Water Samples and Standard Solutions.
Figure 3. Concentration of Total Phosphates in Water Samples.
Conductivity and pH: The results of the pH, conductivity, nitrates, and phosphates are summarized in Table 3 . Table 3. pH, Conductivity, Nitrates, Phosphates.
The pH is a measurement of the acidity of the water, or the amount of free hydronium ion. A decrease in the pH number means an increase in the acidity. The pH readings of the sampled sites are slightly acidic with no visible trend relative to the location of the ponds. The conductivity is a measurement of the ions in the water. The ions include the nitrates, phosphates, and other soluble ions. The measurement of pH and conductivity is affected by temperature, so the measurements of the samples will be affected by the warmer sample temperatures because the samples were stored at room temperature prior to completing the experiment. There appears to be a possible relationship between pH and conductivity; the higher the pH measurement then the higher the conductivity measurement which concurs with the principle that increased concentrations of ions would increase conductivity. There appears to be a relationship between nitrate concentrations and pH; the highest pH value correlates with the lowest nitrate concentrations [Sample 3], and the lowest pH correlates with the highest nitrate concentrations [Sample 1]. The more acidic water contains higher concentrations of nitrates. Similarly, there appears to be a relationship between phosphate concentrations and pH; the highest pH value correlates with the lowest phosphate concentrations [Sample 3], and the lowest pH correlates with the highest phosphate concentrations [Sample 1]. The more acidic water contains higher concentrations of phosphates. Similarly, as conductivity is related to pH, there is a similar correlation between conductivity and the nitrate concentrations and phosphate concentrations. It would stand to reason that samples with the highest conductivity would have the highest ionic concentrations; however, the findings are the opposite. The trend is that the sample with the highest conductivity correlates to the lowest concentrations of nitrates and phosphates (Sample 3) and the sample with the lowest conductivity correlates to the highest concentrations of nitrates and phosphates(Sample 1). A possible explanations is that there are ions other than nitrates and phosphates that are responsible for the conductivity readings. The suggested relationships and correlations between pH, conductivity, nitrates and phosphates are not conclusive. The number of samples taken is too small to perform a comprehensive statistical analysis of the data. The trends are general indications of possible relationships that would require additional sample data to be tested. In addition, there may be other factors that affect the results including temperature, and other substances in the water. The experiment examined a solitary sampling with respect to a temporal scale; seasonal fluctuations in precipitation amounts, stream flows, temperature, and detritus may alter the water chemistry of the stream. In addition, there are less extreme changes in stream water chemistry on a daily cycle. A clear objective would need to be defined in order to determine the sampling parameters that would be required to meet the objective. The potential sources of error include the dilution of the standards with multiple additions of water to dilute the standards; the multiple steps would increase the possibility of error in the actual concentration of the standards. Consequently, the interpolated concentration of the ionic species of interest would be in error. In addition, the absorbance readings corresponding to the phosphate samples were possibly outside the precision tolerance of the spectrophotometer. It is recommended that all stream test results data be stored in a data base to develop base line data for Royal Roads University. The data results could be incorporated from the Foundations program, and each subsequent set of water chemistry analysis results be added to the data base. The data base could be a simple Excel spreadsheet, that can be utilized by a statistical analysis software package. The benefits of recording all water chemistry sampling results is that the number of data points increases significantly when all test results are incorporated into the data set. It would be a more effective data set to test water chemistry hypothesis for later experiments; for example, to test a correlation hypothesis regarding pH and nitrates. In addition, it may provide useful base line data to the environmental management of the property; for example, if there is an event or a change in surface chemicals applied to the property, and base line data is required to perform a comparison analysis of pre-event and post-event. The compilation and storage of base line data pertaining to the surface waters of Royal Roads University is beneficial to Royal Roads University in the role of education and environmental stewardship of the grounds. Department of Environmental Science. 1997. Laboratory Manual. pp. 5-1 to 5-4. pp. App IV-1 to pp. App IV-2. Royal Roads University, Victoria, B.C. Manahan, Stanley E. 1994. Environmental Chemistry. Sixth Edition. Lewis Publishers of CRC Press. Boca Raton,Florida. 811 pp. Map. Figure 1. Department of Environmental Science. 1997. Laboratory Manual. Handout. Royal Roads University, Victoria, B.C. Sigmund, Charles A. 1996. Pristine Waters: Examining the Chemistry of Streams, Lakes, and Rivers. Langara Press, Vancouver, B.C. 147 pp. Please be aware that this is a student level lab and has not been peer reviewed by a professional journal. Please refer to primary journal publications for additional information for your research. Student labs are my favourite part of learning because each is a prototype mini-project with multiple stages in: planning, doing, analysing, and writing. Gone Paddling...
| |||||||||||||||||||||||||||||||||||||||||||||||||||||||||||||||||||||||||||||||||


 email Waterose
