 | ||||||
| Articles | Projects | Resume | Cartoons | Windsurfing | Paintings | Album |
The Effects of the Proximity of the Marine Environment
on Biodiversity in Microhabitats within a Salt Marsh

by Waterose
Section 2. Methods:
2.1 Study Plot:
2.2 Microhabitats:
2.1 Preparation of the Study Plot:
2.1.1 Overview:
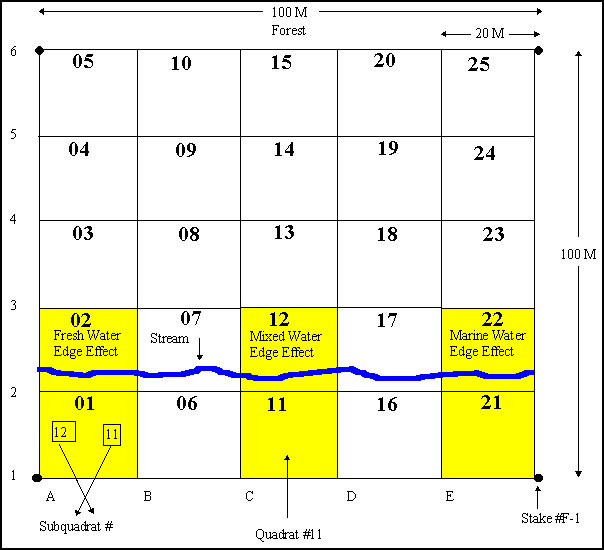
The methods used to set up the plot were based on the design protocols of the joint Smithsonian Institute and Man and the Biosphere program of United Nations Educational, Scientific and Cultural Organisation (UNESCO). The plot preparation included set-up, survey, and measure of this plot starting with the tree canopy and working to the soils level. The study plot was further divided into twenty metre subquadrats, and random one metre quadrat samples were obtained from each of the microhabitats to identify the species within each of the microhabitats. The data was collected and electronically entered into a class data base. The set-up is illustrated in Figure 1.

The primary points used to set up the study plot were professionally surveyed and marked on the provided map. These points were indicated in the plot by a metal stake in the ground and flagged on an adjacent stick. The four corner points of the plot were marked with aluminium stakes. The surveyed points on the map were not in a square due to problems encountered in getting a direct line of site in the forests. Once the four corner points were located the twenty metre by twenty metre quadrats were set up by using compasses, clinometers (for correction of slope to ensure each quadrat contained four hundred square metres regardless of topography), and hypsometers which performed the correction function automatically. The other stake points on the surveyor’s maps were used as a guide to complete the set-up.
The twenty metre by twenty metre quadrat corner marking stakes and the plot corners were labelled according to the schematic layouts of the site as illustrated in Figure 1. Short aluminium stakes were used to mark the individual quadrat corners. Each of these stakes was labelled according to the numbering systems provided in Figure 1. A PVC pipe and cap was placed over each of the metal stakes for safety reasons and labelled.
As each quadrat was subsequently laid out and marked with stakes in the plot site, a preliminary reconnaissance survey was conducted on each twenty metre by twenty metre area along the plot transect. This took the form of a biophysical assessment in each area consisting of descriptive information relating to canopy, slope, hydrological conditions, other features and species present.
2.1.2 Quadrat Descriptions:
There are two primary types of sampling techniques that are used to inventory flora biodiversity. One method is a line transect technique where the organisms that touch a line transect are enumerated, and another method is the quadrat sampling technique where the organisms that lie within a quadrat are enumerated. A quadrat is a square sample unit. The quadrat technique was used to identify and enumerate the species in the saltmarsh.The method of sampling can be either biased or random; the objective is to obtain sampling data that is representative of the system that is being studied. The selection of the quadrats that defined the three microhabitats was biased in order to obtain representative data for each system.
The size of the microhabitats was defined by combining the areas of two adjacent quadrats that were twenty metres by twenty metres, thus each microhabitat was represented by eight hundred square metres.
Within each microhabitat, the sampling regime of the subquadrats was random. The selection of the size of the sampling subquadrat is important relative to the size of the organisms in the ecosystem under study. The dominant vegetation of the saltmarsh is less that half a metre tall, so the suitable sampling subquadrat size was one square metre.
2.2 Enumeration of the Microhabitats:
The one metre square quadrat frames were randomly distributed (nested) throughout each main twenty metre by twenty metre quadrat. Within each quadrat frame, the percent cover of each identified species was assessed. Five subquadrat samples were obtained for each quadrat, with a total of ten random subquadrats enumerated for each microhabitat.
2.2.1 Quadrat Positioning:
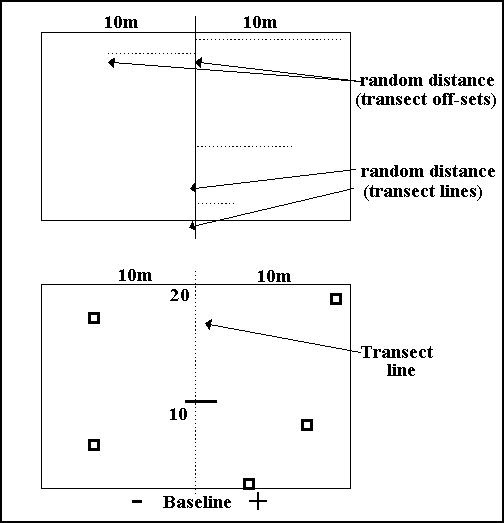
The positioning of the subquadrats involved selecting positions from a set of random numbers to determine distances off of a central transect. In each quadrat that was sampled, a transect was set up at the ten metre mark along the baseline running the length of the quadrat. The tape measure was used to mark this line. The random number tables (Transect lines) supplied a random number between 0 and 20 to identify the random distance. At the random distance, the random number table provided another number between 0 and 10 (Transect off-sets) to measure the distance either right or left of this point. The direction was altered at each point. There were five points used across at each transect. The process is illustrated in Figure 2 below.

To Section 3. Results:
Index:

 email Waterose
Please Sign My Guestbook
Please View My Guestbook

| Articles | Projects | Resume | Cartoons | Windsurfing | Paintings | Album |
 | ||||||