 | ||||||
| Articles | Projects | Resume | Cartoons | Windsurfing | Paintings | Album |
The Effects of the Proximity of the Marine Environment
on Biodiversity in Microhabitats within a Salt Marsh

by Waterose
Section 3. Results:
The results of the study are summarised in this section. These results include the identification of the three microhabitats, the list of species identified, the Anova analysis, and the T-test analysis. The biodiversity analysis is the total number of different microflora species in a given location and not the abundance of those species.3.1 Microhabitat Identification and Number of Species:
The microhabitats are identified in Table 1 below with the population number, the quadrat number, the subquadrat number, the location code, the mean number of species, and the standard deviation. The marine water edge was located at the edge of the salt water lagoon. The fresh water edge microhabitat was located the most distant from the marine water edge influence. The mixed water edge habitat was located equidistant from the marine water edge influence and the fresh water edge influence.Table 1. Microhabitat Identification and Number of Species
| Name | Population No. | Quadrats | Subquadrats | Locations | Mean No. Species | Standard Deviation |
|---|---|---|---|---|---|---|
| Fresh Edge | 1 | 1 2 |
1-5 1-5 |
111-115 121-125 |
3.60 | 1.174 |
| Mixed Edge | 2 | 11 12 |
1-5 1-5 |
211-215 221-225 |
3.00 | 0.943 |
| Marine Edge | 3 | 21 22 |
1-5 1-5 |
311-315 321-325 |
1.90 | 0.994 |
3.1.1 Species Identified in the Three Microhabitats:
The list of the herbaceous and grass species identified in the microhabitats are summarised below in Table 2. There were twenty-two species of microflora identified with the exception of moss and dead grass. Most of the species were habitat specific, three species were dually adapted and only one species, Silverweed (Potentilla anserina), was common to the three microhabitats.Table 2. List of Species Identified in the Three Microhabitats
| Species Code | Common Name | Species Name | Microhabitats |
|---|---|---|---|
| 1 | Annual Bluegrass | Poa annua | Mixed |
| 2 | Aster | Aster chilensus | Mixed |
| 3 | Blue Grass | Poa pratensis | Fresh |
| 4 | Buttercup | Ramunculus repens | Mixed |
| 5 | Cattail | Typha latifolia | Fresh |
| 6 | Common Rush | Juncus effusus | Fresh, Mixed |
| 7 | Curled Dock | Rumex crispus | Fresh, Mixed |
| 8 | Dead Grass | - | Marine |
| 9 | Dog Nettle | Urtica urens | Fresh |
| 10 | Dune Grass | Elymus mollis | Mixed |
| 11 | English Ivy | Hedra helix | Fresh |
| 12 | Grey Sedge | Carex rossi | Fresh |
| 13 | Moss | - | Fresh |
| 14 | Puccinella | Puccinellia nutkaensis | Marine |
| 15 | Quackgrass | Agropyrons repens | Marine |
| 16 | Redwood Sorrel | Oxalis oregana | Fresh |
| 17 | Sea Arrow | Triglochin aritimum | Mixed |
| 18 | Silverweed | Potentilla anserina | Fresh, Mixed, Marine |
| 19 | Sitka Sedge | Carex aurea | Fresh |
| 20 | Skunk Cabbage | Lyischiton americanum | Fresh |
| 21 | Slough Sedge | Carex obnupta | Mixed, Marine |
| 22 | Wild Oat | Avena fatua | Mixed |
3.2 Comparison Between the Mean Number of Species in the Three Microhabitats:
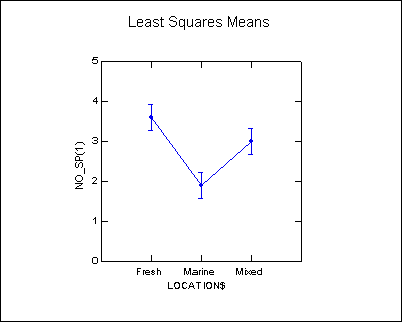
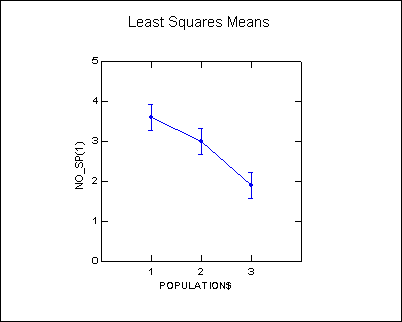
The Anova analysis in Figure 3 below illustrates the comparison between the mean number of species in each microhabitat. The F-ratio is 6.850 and the p-value is 0.004. The confidence intervals do not overlap and there are significant differences in the mean number of species for each of the microhabitats at the ninety-five percent confidence interval. There appears to be a larger difference in number of species for the fresh water edge microhabitat compared to the mixed and marine water edge microhabitats.The Anova analysis in Figure 4 below illustrates the comparison between the mean number of species in each population. The F-ratio is 6.850 and the p-value is 0.004. The confidence intervals do not overlap and there are significant differences in number of species for the three populations at the ninety-five percent confidence interval. There appears to be a larger difference in number of species for population one compared to populations two and three.
The Anova analysis indicates that there is a significant difference in the mean number of species in the three microhabitats or populations at the confidence interval of 95 percent. Therefore, further analysis was required to identify if there was a significant difference between pairs of microhabitats or populations.
3.3 Comparison Between the Mean Number of Species Between Paired Microhabitats:
The pairwise comparison between the mean number of species in each microhabitat was completed by T-test analysis. The summary of the pairwise T-test analysis are summarised in Table 3 below. The P-values for the marine-fresh water comparison, and for the marine-mixed water edge microhabitats are less than 0.05 so the null hypothesis is rejected and there is a difference in the mean number of species in these pairwise comparisons. The P-value for the fresh-mixed water edge comparison is greater than 0.05 so the null hypothesis is accepted as there is no difference between the mean number of species in this pairwise comparison.Table 3. Pairwise T-Test Analysis of the Mean Number of Species in the Microhabitats
| Pairing | Probability Value | H0 | Locations are: |
|---|---|---|---|
| Marine and Fresh | 0.003 | Reject | Different |
| Marine and Mixed | 0.021 | Reject | Different |
| Fresh and Mixed | 0.224 | Accept | Similar |
3.3.1 Mean Number of Species Between the Marine Water and Fresh Water Microhabitats:
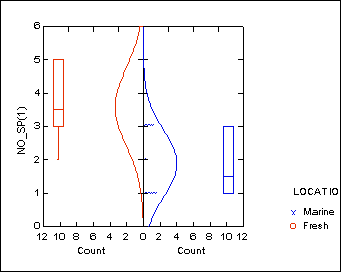
The mean number of species T-test comparison between the marine water and the fresh water edge microhabitats is illustrated below in Figure 5. The mean number of species for the marine water edge is 1.90 with a standard deviation of 0.994, and the mean number of species for the fresh water edge is 3.60 with a standard deviation of 1.174. This indicates that there was a higher mean number of different species in the subquadrats in the fresh water edge microhabitats but also a wider range of the number of different species within the ten subplots. The marine water edge microhabitat had both a lower mean number of species in each subquadrat and a lower range of the number of different species within the ten subplots. The difference is significant at the ninety-five percent confidence interval because the P-value is less than 0.05, and consequently the null hypothesis is not accepted for the pairwise comparison between the marine water and the fresh water edge microhabitats.
3.3.2 Mean Number of Species Between the Marine Water and Mixed Water Microhabitats:
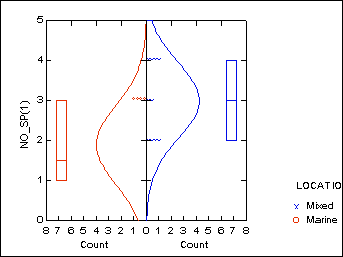
The mean number of species T-test comparison between the marine water and the mixed water edge microhabitats is illustrated below in Figure 6. The mean number of species for the marine water edge microhabitat is 1.90 with a standard deviation of 0.994, and the mean number of species for the mixed water edge microhabitat is 3.00 with a standard deviation of 0.943. This indicates that there was a higher mean number of different species in the subquadrats in the mixed water edge microhabitats but a very similar range of the number of different species within each of the ten subplots. The marine water edge microhabitat had the lower mean number of different species in each subquadrat but a slightly higher range of the number of different species within the ten subplots than the mixed water edge microhabitat. The difference is significant at the ninety-five percent confidence interval because the P-value is less than 0.05, and consequently the null hypothesis is not accepted for the pairwise comparison between the marine water and the mixed water edge microhabitats.
3.3.3 Mean Number of Species Between the Fresh Water and Mixed Water Microhabitats:
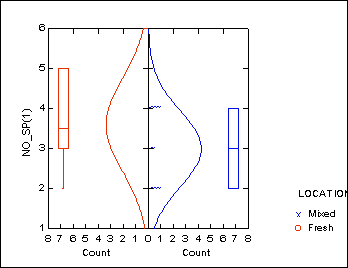
The mean number of species T-test comparison between the fresh water and the mixed water edge microhabitats is illustrated below in Figure 7. The mean number of species for the fresh water edge microhabitat is 3.60 with a standard deviation of 1.174, and the mean number of species for the mixed water edge microhabitat is 3.00 with a standard deviation of 0.943. This indicates that there was both a higher mean number of different species in the subquadrats in the fresh water edge microhabitats and a higher range of the number of different species within each of the ten subplots. The mixed water edge microhabitat had the lower mean number of different species in each subquadrat and a lower range of the number of different species within the ten subplots than the fresh water edge microhabitat. However, the difference is not significant at the ninety-five percent confidence interval because the P-value is greater than 0.05, and consequently the null hypothesis is accepted for the pairwise comparison between the fresh water and the mixed water edge microhabitats.
To Section 4. Discussion:
Index:

 email Waterose
Please Sign My Guestbook
Please View My Guestbook

| Articles | Projects | Resume | Cartoons | Windsurfing | Paintings | Album |
 | ||||||
