


The following animated maps were borrowed from the
Washington Post web page. To see the Post's sprawl web page, go to
http://www.washingtonpost.com/wp-srv/local/longterm/library/growth/front.htm
and click on "Development Maps."
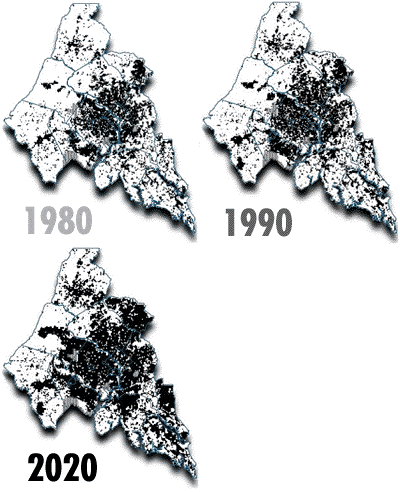


For an un-animated version, see below:
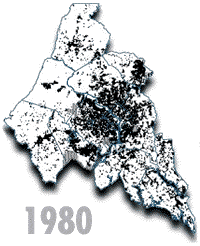
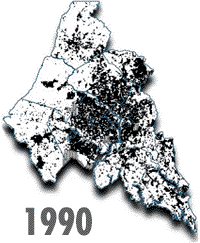
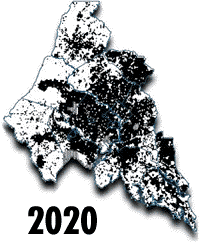
Here is an excerpt from the text written by the Washington Post:
|
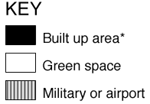
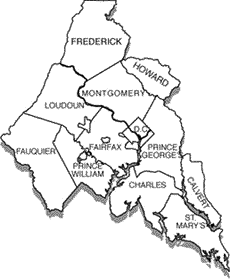
Here's a look at how the Washington region is losing green space. The black markings on the maps [above] show the region's built-up area, or the land that has been converted from forests and farms to residences, commercial and industrial development. White areas reflect remaining green space in 13 selected jurisdictions (see the key map above at right). In 1980, the region was surrounded by forests, farms and wetlands a short drive from the District and its immediate suburbs. Then came the boom years of the '80s when Washingtons's regional growth rate was exceeded only by that of Los Angeles. Between today and 2020, the region is projected to lose about 28 acres of green space a day, the equivalent of 21 football fields, much of it in the outer suburbs.
*Maps are based on a housing density of one unit per 10 acres. |
Return to Virginia Sprawl