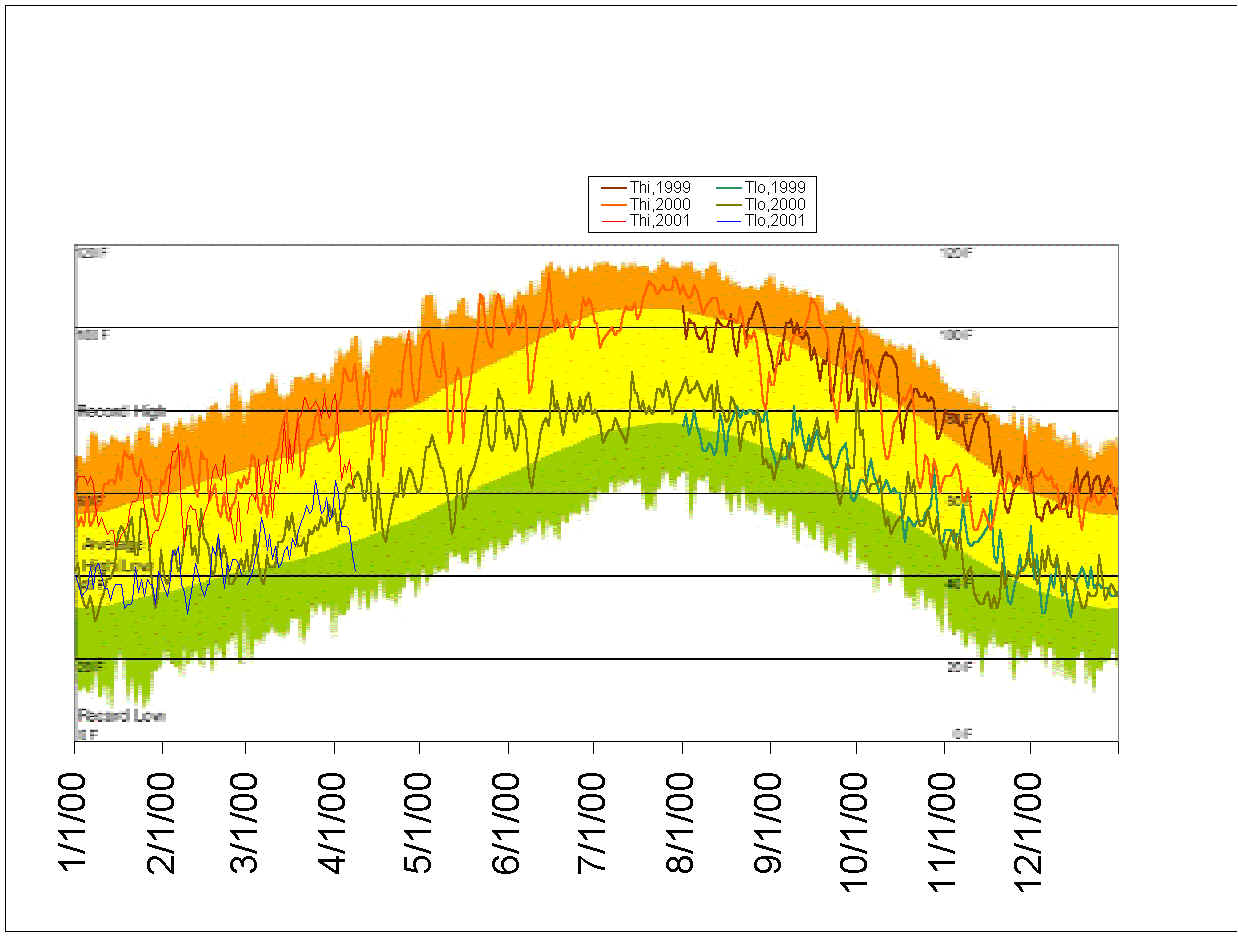
To illustrate how recent years' temperatures in Las Vegas have been higher than normal, here is a graph that shows average, record, and recent temperatures. If you can't figure out what all the lines mean, let me know and I'll try to clarify. But the legend really does explain it all.
By the way, the 0.07" of rain that fell at the Las Vegas airport on 2 August 2000 was the first measurable precipitation in 146 days, just 4 days short of the record dry spell. However, we did get about 1/2" in Henderson on 23 July 2000, even though nothing fell at the official weather station at the airport.
This graph is 2 years old. Click here for an Excel spreadsheet with much more recent data (requires Internet Explorer to view).

| Designed for Netscape and Microsoft browsers, version 4.5 or higher Copyright (©) 1997-2006 Tyconium Stent Enterprises |