Temperature and Latitude Study

Required

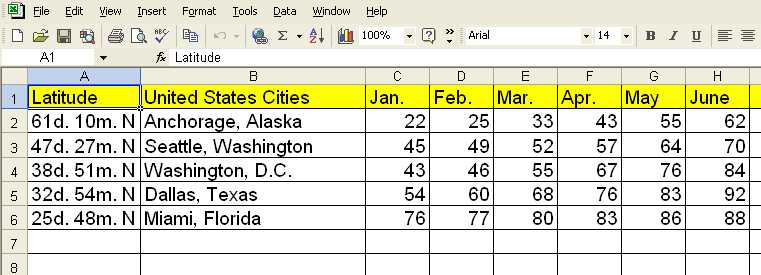
Use the Internet to find average high or low temperatures for 5 different cities in the United States over a six-month period from January to June. The cities you choose must be at least 5 degrees apart in latitude. Use Microsoft Excel to create a chart.

Next, create a line graph depicting the temperature differences.
Line graph example:
REQUIRED
Printed Report in WORD:
I. Proper header with name, date, section, and title.
March 15, 2001 John Appleton 5-D
Temperature and Latitude Study
II. Graph page: Paste line graph and chart from Excel.
(see examples above)
Start with a topic sentence that states the purpose of your research. Follow with three observations about the data in your graph. Comment on the lowest and highest temperatures, and temperature ranges for cities you have selected. Also write about anything you did not expect to find. For example, did you find temperatures for northern cities to be warmer that southern cities? Use geography to try and explain why this may be the case.
III. Bibliography: Include Internet resources (see below).
Weather Resource:
United States Average Temperatures and Precipitation
http://countrystudies.us/united-states/weather/
USA
Today Almanac
http://www.usatoday.com/weather/climate/usa/wusaclim.htm
Provides monthly temperature averages by city and includes latitude
& longitude.
Latitude and Longitude resource:
Look-up Latitude
and Longitude USA
http://www.bcca.org/misc/qiblih/latlong_us.html
Various US cities categorized by state.
Map Resource:
University
of Texas Map of USA
http://www.lib.utexas.edu/maps/united_states/united_states_pol02.jpg
Large map of the United States with latitude markers every 10 degrees.
Includes Alaska and Hawaii.
NOAA Interactive Map:
http://www.cdc.noaa.gov/USclimate/states.fast.html
Scoring:
| Cover page with map & header | 10 points |
| Line graph | 30 points |
| Excel chart | 30 points |
| Cities 5 degrees latitude apart | 20 points |
| Bibliography | 10 points |
Created for 5th grade social studies by Mr. Brown
Last updated: February 23, 2005