![]()
Coupled Oscillators demonstrates the dynamics of mutually coupled oscillators, or in a more biological language: it simulates dueting males of the tropical katydid Mecopoda elongata L. The model is based only upon phase response curves and chirp cycle lengths.
The program uses experimental data I found in the process of my master thesis "Dynamik des Gesangs der Laubheuschrecke Mecopoda elongata L." (in English: "Dynamics of the calling song of the katydid Mecopoda elongata L."). Coupled Oscillators was never part of my thesis, I developed it just for my pleasure.
Coupled Oscillators is written in Borland Turbopascal 6.0 for DOS.Same as in Kyberniidae is not very user friendly, has no help system, is keyboard controlled (no mouse) and some manipulations are a little bit strange. And sometimes terminology within the program is inconsistent (e.g. synonyms are animal=Tier=system=oscillator). The reason is that the genesis of Kyberniidae was rather evolutionary than creational or logical.


One feature of Coupled Oscillators is a 2-dimensional
cellular automata. Every cell is an oscillator having the properties shown
in diagrams on the left upper side of the screens. One property
is the phase response curve (PRC), the other is the freerun cycle length.
Every cell can "hear the chirp" of four (or eight) neighbors.

Fig. 1: 70x70 Grasshoppers are sitting regularly on a
grid. Every animal has the same PRC and 2000 ms is the period between two
chirps in freerun; and every animal can hear his nearest eight neighbors.
At time=0 phases of individuals chirp circles were random. 1 min 2.35 sec
later (in insect's time) the spacio-temporal pattern of choir looks like
that. Black cells are just silent animals, colored cells are chirping ones.
The color indicates amount of deviation of circle length from freerun (compare
colors in upper left diagram).

Fig. 2: Parameters like Fig 1, but 50x50 cells, and there
is noise: freerun circle lengths are normal distributed (mean: 2000 ms,
standard deviation 50 ms), and also PRC is gaussian noisy. 0.01 is standard
deviation of PRC in y dimension and of every chirp circle, too.
You see the pattern displayed after 1 min 48.6 sec (after
start at random phases)

Fig. 3: Cell colors depending on instantaneous phase state.
70x70 cells, no noise, random start, 8 neighbors. Pattern after 1 min 1.2
sec.

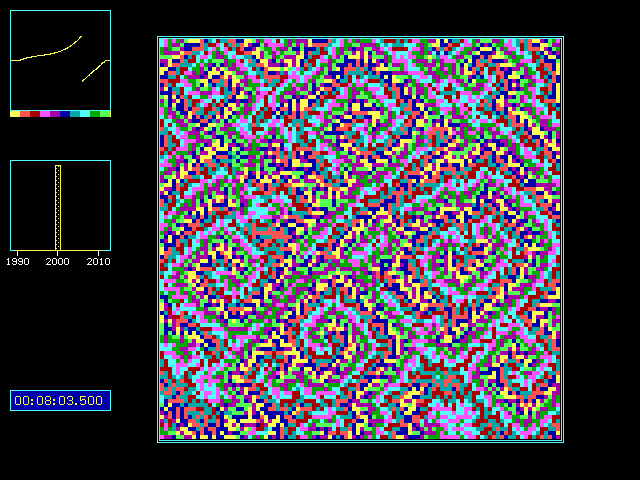
Fig. 4: Parameters like in previous figure, except 100x100 cells and only four neighbors! State after 8 min 3.5 sec.