S y s t e m A n a l y s i s
| HOME PAGE | INTRODUCTION | LINKS |
| NOVITA' |
Municipal solid waste generation:
an analysis
ABSTRACT
Municipal solid waste is generated from urban metabolism. The parameters which influence municipal waste generation were identified. For this purpose a dynamic model of waste generation was developed. The main descriptors analyzed were Net Income, Consumption of Goods and Services, Population and Material Intensity of waste. The dynamic model showed that waste flows are influenced to a greater extend by Net Income. The other descriptors play a minor role. From a systems point of view, the central model reports no stocks and no feedbacks, due to the dominant perception of municipal waste as a one-way flow of materials until they leave the system. The model has been validated in the case of Milan, Italy.
Key words: municipal solid waste, waste generation, dynamic modeling, waste management, Milan.
INTRODUCTION
Since urban waste problems have arisen, they have mainly been approached by end-of-pipe methods which focus on the destiny of the material flows of waste, regardless of their origins. The result of this approach is the development of systems and technologies of waste disposal, inceneration and recently of recycling and reuse (Sundberg, et al., 1994).
Few attempts have been made to explore the generation of waste as an emerging phenomenon of the metabolism of urban systems (Gilnreiner, 1994; Petersen et al, 1995). As in the case of biological organisms, metabolism is defined here as the fundamental process necessary to sustain system organization. It is well known that an urban system fuels its metabolism with the input of energy and raw materials. The function of urban metabolism, at least in democratic consensus seeking societies, is to supply resources for supporting the well-being of individuals living in the urban system. Since materials that have circulated in urban metabolism, cannot disappear after consumption, an output flow of waste materials is generated. As a matter of fact, policy regulations and waste management laws regard material flow in urban metabolism as linear and unidirectional.
Applying a flows approach to urban waste, shifts the perspective from standard waste composition and destination analysis to a systems approach where total material flows are relevant. Furthermore, the scope of a waste generation analysis encompasses the identification of the relations among different issues which determine material throughput in urban systems (Chickte et al., 1976; Sudhir et al., 1997; Haslett et al., 1998).
THE MODEL
A new system dynamics model was developed in order to explore the behavior of waste flows with reference to different variables of an urban system. The objective was to develop a model of the present reality of municipal solid waste in order to identify the main descriptors of waste generation.
The consideration of variables to include in the model was left open in order to allow innovative aspects to qualify for the model. In fact, as literature reports (Cailas et al., 1996), socioeconomic variables are thought to be highly correlated with waste production. After brainstorming and literature analysis, the principal variables finally included in the model were: Per Capita Net Income, Per Capita Consumption of Goods and Services, Material Intensity of Waste (also referred as De-materialization) and Population.
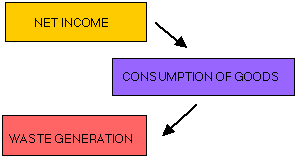
The model was built according to a central concept illustrated in Fig. 1. The central idea of the model is the influence of Net Income on Consumption of material Goods which affects material throughput of urban metabolism, and furthermore, determines waste generation. More income (i.e. more resources) leads to more consumption and therefore more waste. This statement is generally true as far as we are concerned with a consumer-based society. However, it would be interesting to study the validity of this concept in other societies.
Fig. 1 - Basic dynamic model concept of municipal solid waste generation. Net Income influences consumption patterns which affects Waste Generation. A feedback from Waste Generation to Net Income is missed in the dominant system and therefore not considered in the model.
The main variables which characterize the model are briefly described in the following section.
Per capita Net Income
Net Income results in a fundamental parameter for explaining the behavior of waste generation because of its direct correlation with consumption of goods, which conveys the material flow until there is waste generation. In fact according to economic theory, net income is devoted to consumption of goods, services and savings. Therefore, ceteris paribus, higher income is correlated with more consumption, and also with larger material throughput in the economy.
Per Capita Consumption of Goods and Services
In the model, final consumption is defined as a function of Net Income. It is assumed that consumption is influenced by trust that consumers place in the economy. In fact, in the case of the perception of a profitable economic future, people are more likely to purchase and consume goods compared to the case in which consumers feel a hopeless future of poor economic conditions. The trust that consumers place in the economy is defined in the model as the derivative of the difference of present income and expected income. In other words, if income is expected to decrease, trust vanishes and consumption falls; if income is expected to increase, trust strenghtens and consumption grows. The system income-trust-consumption is highly sensitive. In fact, consumption is supposed to be a proxy of expected income. Further, the resulting consumption is disaggregated in non-material consumption (e.g. services, energy supply, rent, travel expenditures), non-durable goods consumption (e.g. food products and detergents with their packagings) and durable goods consumption (e.g. furniture, equipment).
Material Intensity of Waste
The term de-materialization defines the reduction over time of material content of goods and services keeping constant their economic utility. According to Alter (1989 and 1993) heavy materials (glass and iron) are substituted with lighter materials (plastics, aluminium) and the weight fraction of plastics packaging residues stands in inverse correlation with the weight fraction of food residues. Based on this point of view, a coefficient of Material Intensity of Waste is set up which is determined by the share of plastics on Total Waste collected. Furthermore, this approach also made it possible to determine the average energy content of waste.
Population
The number of inhabitants is obviously relevant to waste generation. The model describes population in terms of night-time population (residents) and day-time population. The latter is calculated as the sum of residents and net balance of commuters.
Model description and assumptions
Fig. 2 shows an expanded outline of the model which illustrates its internal dynamics. As mentioned above, Per Capita Net Income defines Trust in the economy which determines Per Capita Consumption of Goods and Services. Technically, this is done in a way where the variable Trust affects the value of the standard macro-economic coefficient Propensity to Consume within an acceptable range from 0.7 to 0.88. These extreme values of the Propensity to Consume have been calculated from final consumption statistics (years 1985-1992).
Fig 2 - Model outline of municipal solid waste generation.
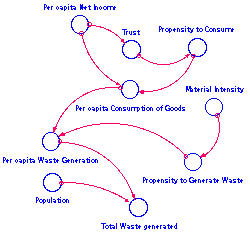
Once Per Capita Consumption of Goods and Services is determined, the equivalent material flow can be calculated using a historical coefficient. The 1985 ratio between weight of collected waste and consumption of goods was calculated from historical data (weight of waste/unit of consumption). The result was set as the starting value for a new coefficient: the Propensity to Generate Waste. In analogy to the macro-economic Propensity to Consume, this Propensity describes the tendency of consumption to be transformed into waste. The coefficient Propensity to Generate Waste changes its value over time depending on the progress of the variable Material Intensity, thus, reflecting the trend of de-materialization of waste.
Finally, Per Capita Consumption and Propensity to Generate Waste define Per Capita Waste Generation, which multiplied by the number of day-time inhabitants gives the total amount of waste generated.
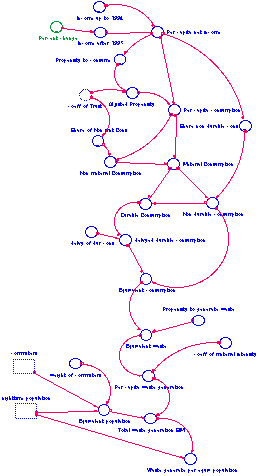
The detailed model including the sub-models are illustrated in figures 3, 4, 5 and 6.
Fig. 3 - Detailed submodel of the coefficient of Trust
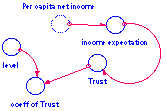
Fig. 4 - Detailed submodel of Material Intensity
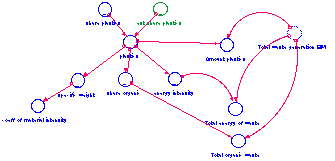
Fig. 5 - Detailed submodel of Population
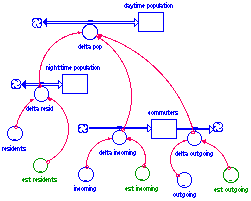
Fig. 6 - Detailed central structure of the model
The assumptions made for the dynamic model are as follows:
- For the purposes of this study the equivalence of waste generation and waste collection is assumed.
- Durable goods keep their utility longer before being discarded. Therefore, Consumption of durable goods in their way to waste are delayed of 1.25 years.
- In terms of waste generation, a commuter in day-time (employee, student, leisure, shopping) is expected to weigh 15% of a resident.
- Weight is used for the measurement of waste.
- Since input figures are not available for every year, interpolation has been undertaken in order to smooth out the time curves of each value. In the case of Specific Weight of waste, the availability of only one punctual datum made it necessary to estimate the curve.
Model validation
The model was validated on the case of Milan, Italy, thanks to the co-operation of Milan Waste Agency A.M.S.A. Actually, the city of Milan was also chosen because its waste outflow shows a very inspiring situation: indeed, the waste collection time series of Milan report a very impressive discontinuity from the year 1994 to 1996. While the general trend of waste collection is increasing over the '80s until up to 1993, from 1994 until 1996 there appears a 12% remarkable reduction of waste collected, compared to the historical maximum of 1993. After 1997, recent data confirm a gradual return to an increasing curve.
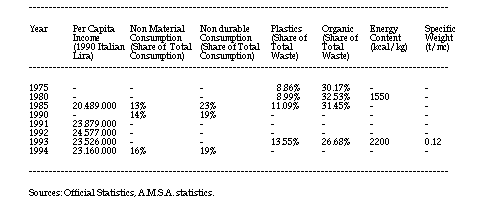
The inputs used for running the model were Residents, Communters, Per Capita Net Income, Share of non material Consumption of Goods referred to Total Final Consumption, Share of non durable Goods referred to Total Final Consumption, Share of Plastic on Total Waste, Share of Organic Matter on Total Waste, Energy content of waste, Specific Weight of Waste. All economic figures were levelled at 1990 prices in order to exclude distortions due to inflation. Input figures are given in table 1. Since Milan reports mainly a service and banking economic structure, industrial production parameters (Added Value and Number of Firms) included in earlier versions, were then omitted because they were proven not to be significant.
Table 1 - Data used as input for the validation of the model, taken from the real case of the municipality of Milan, Italy.
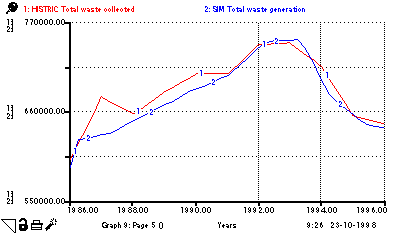
The results of the validation show a successful historical fit over the time period 1985 up to 1996, as reported in Fig. 7.
Fig. 7 - Validation of the model. Comparison of historic curve and simulated curve of waste generation, both expressed in metric tonns, relative to the case study of the municipality of Milan, Italy. In 1993-94 appears the discontinuity which brings to a decrease of waste generation of 12% from the historic peak of 1993.
RESULTS AND DISCUSSION
The dynamic model shows that in the real-case under consideration in this study, materials flowing through an urban metabolism are regulated largely by Net Income and less by present Population. Sensitivity analysis was undertaken to allow for the comparison between Per Capita net Income and Population so that their influence on Waste Generation could be measured. The results demonstrate that Per Capita Net Income causes the most Waste Generation: at present levels of income, a 10% variation of Per Capita Net Income causes a 13% variation of waste generated; on the other hand, a 10% change in Population only causes a corresponding 10% variation in waste generated.
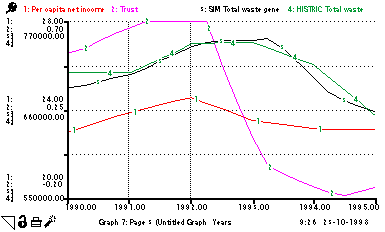
As a result of these findings, the point of discontinuity (heavy decrease) of waste generation at the municipality of Milan can be ascribed to the reduction of Net Income which occured from the years 1993 until 1995-96 in correspondence with the spreading of the worldwide economic crisis and with the urgent tax measures taken by the national government for the recovery of the public debt. The impact of net income on waste generation appears delayed for about one year, as can be seen in Fig. 8.
Fig. 8 - Dynamics at the point of discontinuity. Note the high sensitivity of Trust coefficient to the changes of Per Capita Net Income (expressed in million Italian Lira), and the delayed effect on the simulation curve of waste generation (expressed in metric tonns).
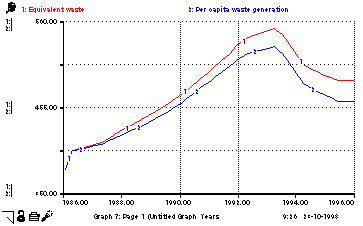
The model allows us to focus on the decrease of material intensity, also called de-materialization. This is a phenomenon which appears in post-industrial economies and which consists of two aspects: composition of consumption of goods and services, and composition of waste. The first is due to the shift of consumption from material products to non-material services. In the model this is considered when disaggregating statistical data on consumption. The second is the substitution of weight of waste materials, as was already mentioned. This aspect is introduced in the model through the slow increase over time of plastic materials in waste collected. Fig. 9 shows the impact of de-materialization in the real-case application: without de-materialization the waste generated would be approximately one fourth larger compared to the present situation.
Fig. 9 - Effect of de-materialization (reduction of material intensity) on waste generation. Equivalent Waste is an expression of per capita waste generation prior to consideration of de-materialization. Per Capita Waste Generation is the correspondent variable after inclusion of de-materialization. The units are metric tonns.
De-materialization affects the material contents of waste generated. However, for transportation and municipal waste management purposes, volume plays a major role. The expected decline in specific weight, estimated in this model, indicate that the volume of waste generated may increase. While material flows tend to decline, volume of waste is supposed to increase, reinforceing the idea that municipal waste will consist mainly out of air embedded in a material structure. The relation weight-to-volume represents an area of further study.
Another interesting aspect which appears in the model is the behavior of material consumption versus non-material consumption at the point of discontinuity of waste generation. Non-material consumption behaves more elastically to income compared to material consumption. This is confirmed by everyday experience: when income declines the expenses cancelled first are travel, leisure and othe non-material expenses. On the other hand, with increasing income the share of non-material consumption grows more than the share of material consumption. This limits the increase of material throughput in urban metabolism. Nevertheless, income remains, according to the results of this study, the main descriptor of waste generation.
In analogy, the model confirms that durable consumption is more elastic to net income compared to non-durable consumption. The latter, represented by material products like food products and office consumables (with relative packagings), are less susceptible to income variations since they represent material flows necessary to sustain daily life of individuals. Durable goods like house or office equipment are investments which can be replaced when income is higher, or repaired and kept longer when times are hard.
From the systems dynamics point of view the model shows some curious aspects. First, the main model has no stocks. In a system dynamics approach variables are divided into flows and links: flows are dependent on time (rates) and become zero if time is stopped (e.g. birth rate, income), whereas stocks are accumulations of past flows and maintain their levels over time like a memory of previous events (e.g. population, wealth). It is important to keep in mind that the model was developed for the description of a waste system as it is perceived by dominant theories. Therefore, the model describes income and waste flows which at the end are disposed outside the system, i.e. into the ecosystem. It is obvious that the point of accumulation (memory) is the disposal, which is placed outside the boundaries of our system. This is the reason why the model describes flows which appear to have no link over time and no memory. This aspect has further implications in the following point.
Second, there are no feedbacks. After thorough analysis, no reasonable feedback could be found between waste generation and income or consumption, if a waste system is observed from the dominant point of view. The missing feedbacks can be ascribed to the lack of stocks and to the lack of memory of past flows. Without feedback no control of output is possible and no balance of the waste system is conceivable.
A balancing link could be introduced by applying a policy which converts garbage taxes (mainly calculated according to surface or family components) into tarifs (calculated on the individual amount of garbage produced). This policy could establish a successful balancing link where waste generated directly reduces net income. The inclusion of a tarif system into a waste management system is a further area for research.
CONCLUSIONS
Municipal waste generation in urban metabolism is influenced by the following main driving forces: net income and population. Net income (together with income expectation) is the major determinant, population is less influential. On the other hand, waste generation is also affected by a countervailing force: de-materialization. While net income increases material intensity of waste and material consumption decrease. The first because of substitution of heavier materials with lighter ones, the latter because of an increase in non-material consumption such as services and travel. The waste system as it is approached today, e.g. in the real-case of Milan, features no stock and no feedback, thus preventing the system to enter into a balance and acquire control of the generation of waste.
ACKNOWLEDGEMENTS
The author would like to acknowledge the waste agency of Milan, AMSA, for data support. Thanks also to Heather Smith for English proofreading. Obviously, the views put forward and any errors are the responsibility of the author alone.
REFERENCES
- Cailas M.D., Kerzee R.G., Bing-Canar J., Mensah E.K., Croke K.G., Swager R.R., 1996. An indicator of solid waste generation potential for Illinois using Principal Components Analysis and Geographic Information Systems. Journal of Air & Waste Management Association, 46: 414-421
- Petersen T.D., Su R.T., Massie K.J., Reinke D., 1995. Modeling spatial variation in the demand for waste collection service. Waste Management & Research, 13: 55-66
- Alter H., 1989. The origins of municipal solid waste: The relations between residues from packaging materials and food. Waste Management & Research, 7: 103-114
- Alter H., 1993. The origins of municipal solid waste: II. Policy options for plastic waste management. Waste Management & Research, 11: 319-332
- Chikte S. D., Levis A. H., 1976. A dynamic simulation of urban litter generation. IEEE Transactions on systems, man and cybernetics, 6,5
- Haslett T., Pivetta C. 1998. The dynamics of garbage collection: A system dynamics case study on privatization. Manuscript.
Sudhir V., Srinivasan G., Muraleedharan V.R., 1997. Planning for sustainable solid waste management in urban India. System Dynamics. 13, 3: 223-246.
- Gilnreiner G., 1994. Waste minimization and recycling strategies and their chances of success. Waste Management & Research, 12,271-283.
- Sundberg J. Gipperth P., Wene C.-O., 1994. A systems approach to municipal solid waste management: a pilot study of Göteborg. Waste Management & Research, 12, 73-91.
(c) SystemAnaysis, 1998
For more information contact: SystemAnalysis
Back to more Research | Torna indietro ad altre Ricerche
Torna indietro alle Novita'


This page hosted by
 Get your own Free Home
Page
