The Genetic Game
CS5350 Fall 1999
Kevin Harris
07Dec1999
Purpose
The purpose of 'The Genetic Game' is to explore the possibility of
learning weights for a set of features using a genetic algorithm.
The basic game is similar to ATTAX, 7-Up spot, and others.
As a sub-goal, I wrote this project to:
- Develop a flexible program for a genetic algorithm.
- Write a flexible game independent of the board.
I aimed to have
the game completely ignore board shape, square shape, orientation, and
size. Currently, the only size and player limitations are the amount
of memory in the computer, and the size of a signed int (approx 2.1
billion for 32 bit numbers). The amount of time required to play a
game does, however, depend on the size of the board, as the larger the
board is, the more possible moves there will be to make.
Note that when I refer to 'square', it means a space on the gameboard,
regardless of actual shape.
Rules for 'The Game'
Goal
The goal of the game is to win, which may be accomplished in one of the following ways:
- Have the most pieces on the board when there are no more empty squares
- Completely eliminate (by means of 'capture') all opponent pieces from the board
Movement
There are two types of moves possible (both may result in a 'capture'):
- 'Grow'
A grow is a move where a piece multiplies by adding a new piece to an
empty square within the 'grow range'. The grow range is typically
the adjacent squares, or squares connected by an edge.
An example of
a grow range is the area marked with a 'G' in figure 1.
- 'Jump'
A jump is a move where a piece is picked up and moved to an empty
square within the 'jump range'. This jump range is typically two
squares away, or any square within the grow range of a square within
the grow range of the piece.
An example of a jump range is the
area marked with a 'J' in figure 1.
The players take turns making moves (if they are able) until either the
board has no empty squares, or all opponent players have no pieces
remaining (in which case the sole remaining player would be free to fill
the remaining squares by growing).
Capture
A player making a move will be able to capture (take over) any opponent
pieces within the grow range of the destination square. Capturing a
piece will change the color of the piece to the color of the player
making the capture. An example of a capture is shown in figure 4, where
'M' is the destination square of the move, the 'C' squares
are squares which the pieces would be captured if they belonged to an
opponent, and the 'X' is an opponent piece which would then be
captured. The board resulting after the opponent piece was captured is
shown in figure 5.
Genetic Portion
Structure
Each individual member of the population contains a floating point number
to represent it's current estimated value, and a bitstring to hold the
genetic data. This genetic data is a sequence of fixed point numbers
(weights of attributes) concatenated together. For my test runs, each
fixed point number was divided up as follows:
- 1 bit -- Positive flag (1 = positive, 0 = negative)
- 4 bits -- Whole number portion
- 4 bits -- Fractional portion
This representation allows me to use 511 distinct numbers in the range of
-15.9375 to 15.9375 (there is a positive and negative 0).
An example population member using 5 attributes (5 fixed point numbers)
can be seen in figure 8.
The estimated value for each member is updated each generation after the
tournament (see below), and whenever a crossover occurs, the offspring
are given the average estimated value of the parents. Whenever a
population member completes a game, it's estimated value is increased (on
win) or decreased (on loss).
Attributes Chosen
The basic attributes that I chose to use include the following (not all
were used for all tests):
- Player piece count
The number of pieces the player has on
the board.
- Opponent piece count
The number of pieces that all opponents
have on the board.
- Safe squares
The number of player pieces inside squares that
cannot be captured (because all of the squares that could grow to them
are occupied).
- Near safe squares
The number of player pieces that are
nearly safe. This is broken up further into multiple attributes based
on the number of squares away from being safe (ie. 1, 2, or 3 squares
away from being safe).
- Risky holes
The number of 'holes' that can be captured by an
opponent if they were to move into them. This is broken down into
multiple attributes based on the number of squares that can be captured
by moving into the 'hole' (ie. an opponent being able to make a move to
capture 4 pieces would be a 4 piece risky hole).
- Holes
The number of 'holes' that exist around player pieces.
- Opponent safe squares
The number of safe squares that the
opponent has.
- Opponent near safe squares
The number of near safe squares
that the opponent has (see Near safe squares above).
Combining the above attributes, I ran various versions of the game
ranging from one attribute (player piece count) to 16 attributes (player
count, opponent count, safe squares, 2 near safe squares, 3 risky holes,
3 opponent near safe, 3 holes, 2 opponent holes).
Competition/Tournament
For each generation, to determine the 'most fit' members of the
population, I used a tournament to adjust the estimated values of the
population. I tried two different tournament methods:
- Round-Robin
Where every member of the population plays a
game against every other member. This requires N*(N-1)/2 games, where
N is the population size (ie. if the population size is 50, then 1225
games are required for the tournament).
- Random selection
Each member of the population competes
against some number (I used 10) of other members. This is not as fair
as the Round-Robin tournament, as some members may compete many more
times than others, but it is much faster. This requires M*N games to
be played, where M is the number of games per member, and N is the
population size (ie. a population size 50 with 10 games each results in
500 games).
At the end of each tournament, the estimated values are adjusted based on
their tournament performance. Again, I tried two methods for this, both
have their problems.
- Percentage of estimated value
The winner would take some
percentage (I tried 10%) of estimated value away from the loser.
- Percentage of games won
Each member would have their value
adjusted by some value times the difference of the percentage won and
50% (ie. if they won 50% of the games, their value won't change, but 40%
decreases value, and 60% increases value). As a result, a population
where all members are equal in performance would produce no change in
estimated value.
Verification
At the end of each tournament, the player with the highest estimated
value would be subjected to some number (I used between 20 and 50) of
games for each of three verification players (to generate graph output,
and to verify that learning was taking place):
- Random
A player who randomly chooses a valid move.
- Capture player
A player who attempts to capture as many
opponent pieces as possible. If no capture is possible, it will take
the move with the most resulting pieces. In the event of a tie, the
equal moves are chosen from randomly.
- Most pieces player
A player who tries to get the most
pieces possible for any given move. In the event of a tie, the equal
moves are chosen from randomly.
Figures
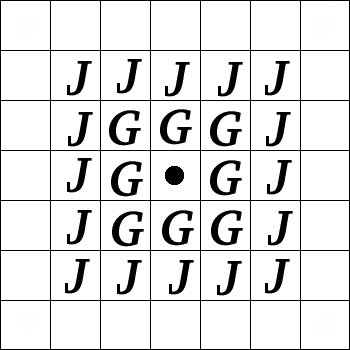
Figure 1: Jump and Grow ranges
|
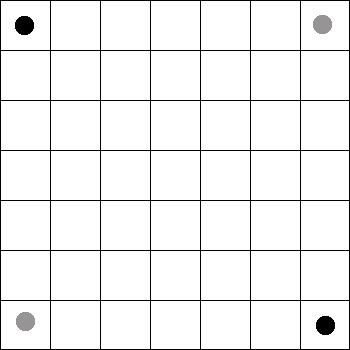
Figure 2: Initial Board positions
|
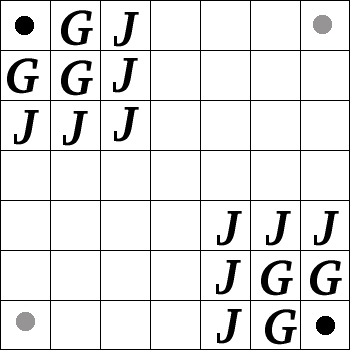
Figure 3: Possible Initial Moves
|

Figure 4: Example of capturing an opponent piece
|
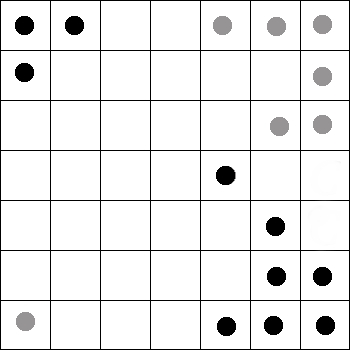
Figure 5: Board after capture in Figure 4.
|
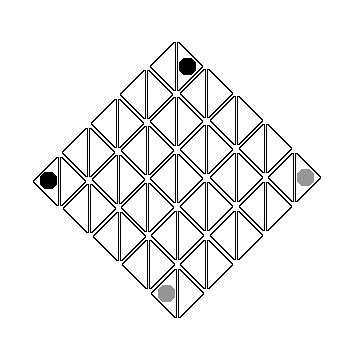
Figure 6: Example of a triangular board
|
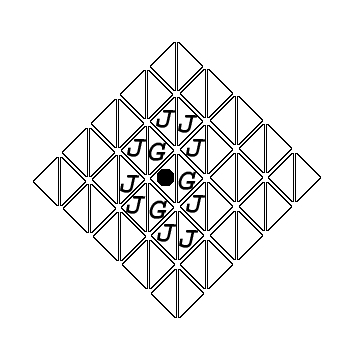
Figure 7: Jump and grow ranges for a triangular board
|
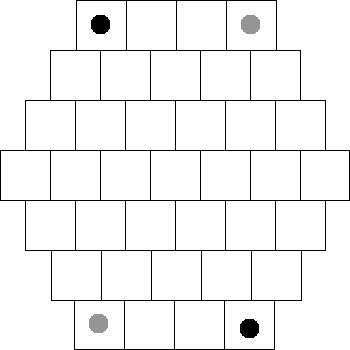
Figure 6: Example of an offset square board
|
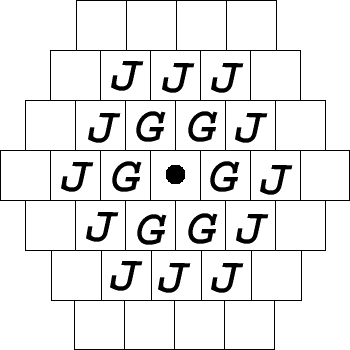
Figure 7: Jump and grow ranges for an offset square board
|

Figure 8: An example of a population member (5 attributes, 9 bits each)
|


