Graphics
 A graphic image is made up of pixels. This is the smallest controllable
display element on the screen. The resolution of the screen is measured
in the number of pixels which are used in the display. All the
images created for this website have been done so at a 800 x 600 resolution.
Vector graphics are based on describing objects mathematically. An example of a vector graphic on this website is the "Top of page" button at the lower left corner of the screen. The up arrow has been created by drawing a vector triangle and rectangle each with a green fill. This has later been converted to a bit map so that it could be displayed in the web browser. Other professional vector graphics can be found in the games Connect4 and Mastermind.
Almost all the images on this website are for raster displays. These displays produce graphics by drawing horizontal lines of individual dots. They require more memory than vector displays but allow shading and other effects.
A bit map image contains a pixel pattern where each pixel is either on or off. The bits in memory determine this as well as the colour, tone and intensity of the pixel. This data is stored in the frame buffer which is also known as the video RAM (VRAM).
Interlacing refreshes the screen in two separate cycles. This can help overcome annoying flicker. Interlacing was used for the large graphic on the Mirabilis ICQ page. A scanner is a type of graphic digitiser which using a strong beam of light to convert printed material into binary form. Some of the images in this website were digitised using a scanner.
Presentation graphics allow data to be presented visually in an easy to understand form. Charts convert columns and rows of numbers into presentation graphics. Several types of charts can be used including bar charts (allowing comparisons) and area charts (showing trends) can be seen in Air Force One Stats.
Simulation uses computer systems and mathematical models to create essential features of real-life or imaginary situations. An example of this is Rubik Unbound which simulates the classical Rubik's Cube.
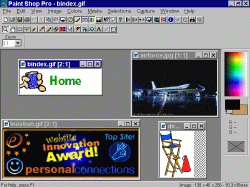
There are two types of illustration programs. They are drawing and paint programs. A drawing program was used to create the "Top of page" button. Drawing programs are vector based. Paint programs are bit mapped based and were used for most of the graphics in this website.
CAD (computer-aided design) programs allow easy editing, different views and reusable objects. CAD programs are commonly used to draw buildings and landscapes. A CAD program was used to create this picture of Pyramids. Layout is the art of combining elements that make up a graphic document. Effective layouts give the reader direction, emphasises sections, is suitable and has a feeling of balance. An important part of this is the positioning of graphics. Graphics in the website have been positioned so they complement the text and do not clutter the page.
Cropping is often used to trim the edges of an image to make it more appropriate. The navigation buttons on the side of your screen contain a hand holding a cup. This image was cropped from a larger image of a man holding a cup. All the graphics on this website went though the process of sizing where the resolution of the image is changed. Distortion was purposely used on the dollar sign in Movies to make it look longer. Colour has also been used to highlight areas and for aesthetic purposes.
Compression software reduces the size of files by looking for patterns of repeating pixels. The earlier graphics in this website such as in the main pages used compression techniques that involved no data loss so the image quality would not be compromised. Lossy compression was used on most of the other graphics but blocking (were pixels are visible when they should not be) and smearing (where edges blur) were avoided.
Animation is an illusion produced by redrawing individual images or frames after a short pause. Eight frames per second is the minimum working speed for animations. There are two types of animations, path-based animations and cel-based animations. Cel-based animation involves a single background where only the objects that move are redrawn. An example of cel-based animation can be seen at Introduction. Path-based animation involves an object being redrawn at a new location while simultaneously erasing the object at the previous location. Path-based animation can be seen with the Scrolling Text applet.
Data integration allows graphics to be shared with other applications. Graphics were transferred from the paint program to word documents and spreadsheets. File conversion filters and the clipboard were used to import and export the graphic files.

| Home | Library | Applets | Movies | Plaza |
Please send any feedback to David Chan