A possible Gold bubble in February?

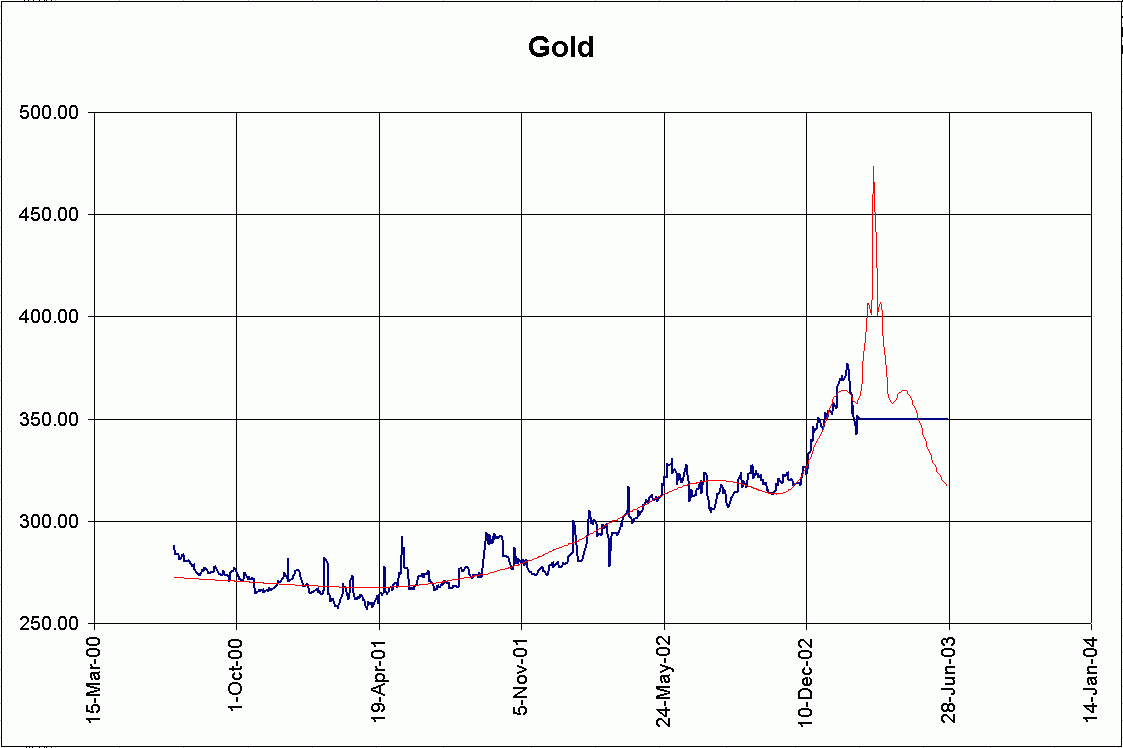
Take a look at my simple calculation based on Sornette's equation last February. The black line is price data through Feb 3, 2003. The red curve is the bubble model:


Sornette's equation

Gold price blow-off.
GOLD

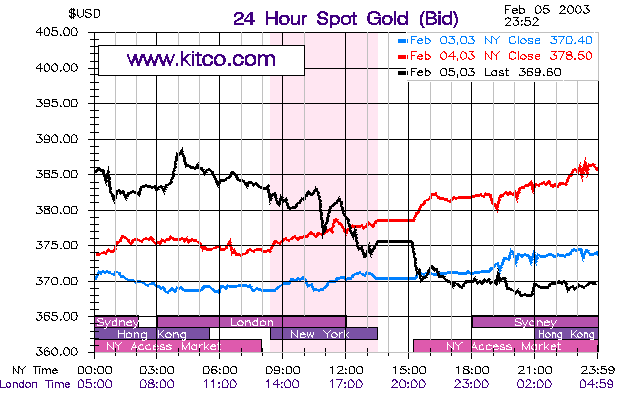
Based on the above chart, I cautiously posted my concerns of a blow-off and crash. Too bad I didn't sell immediately, because the Gold market topped as seen here, the next evening, U.S. time. The "crash" followed over the next few weeks.

February top in Gold prices.

24 hourly Gold prices
1