In short, the current surge in stocks looks like another bubble, one that will eventually burst. - Paul Krugman, Jun. 26, 2003
But I wouldn't argue with it being a "bubblet." - Paul Erdman, July 3, 2003
We call this the echo bubble. This is going to end up badly again. proclained Steve Milunovich, Merrill Lynch & Co.'s chief technology strategist on Aug 24, 2003.
UPDATES:
Sep 5 It is being called an 'echo bubble' by Steve Milunovich, Merrill Lynch & Co.'s chief technology strategist, now that it is about to burst again. So did Paul Krugman back on June 26.
In short, the current surge in stocks looks like another bubble, one that will eventually burst. - Paul Krugman. Jun. 26, 2003
But I wouldn't argue with it being a "bubblet." - Paul Erdman. July 3, 2003
But back on June 17, I emailed friends that I thought I saw the first hints of what looked to me like another bubble. Then on July 3, I started posting here charts of that bubble behavior (see below) computed by data fits to Didier Sornette's formula log-periodic formula.
![]()
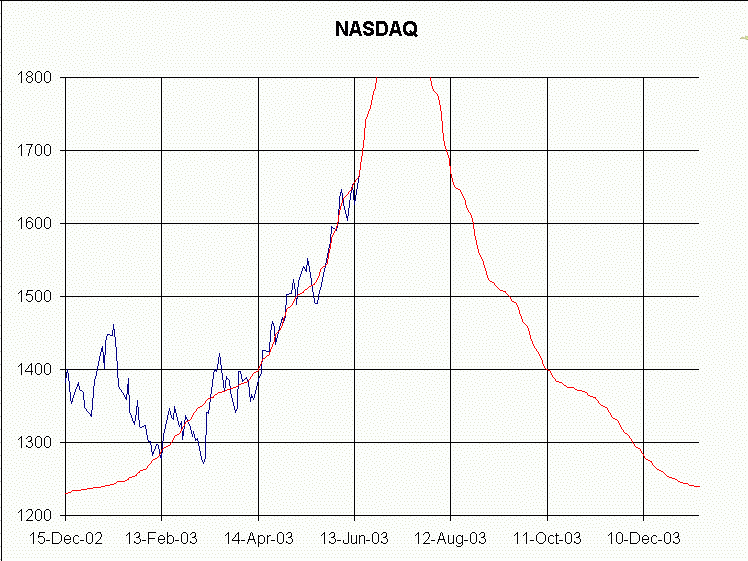
The July 14 calculation modified slightly the model curve. Now a disturbing downward deviation is noted over the last few weeks. The critical time, tc is approximately 26-Sep-03, with about a month uncertainty. The latest model has tc at Oct 9.
The deviation from the model indicates to this observer that it's time to be in cash and/or short. On the other hand, the price is now going up following the model at a lower level. So much for being short!
Sep 24 Here is a chart update, data through Sep 24, curve fit Mar 17 through July 21. This is a rather short time segment, but still exhibits log-periodic power law (LPPL). OK, sold all longs this morning and in cash and short funds. The cycle decorations in the July 21 fit are now down to about two days length. The market is keeping up this pace, as traders look to hourly charts. And we see an OPEC price hike taking the NASDAQ down 3%. It won't take much to get a good correction here, IMO.
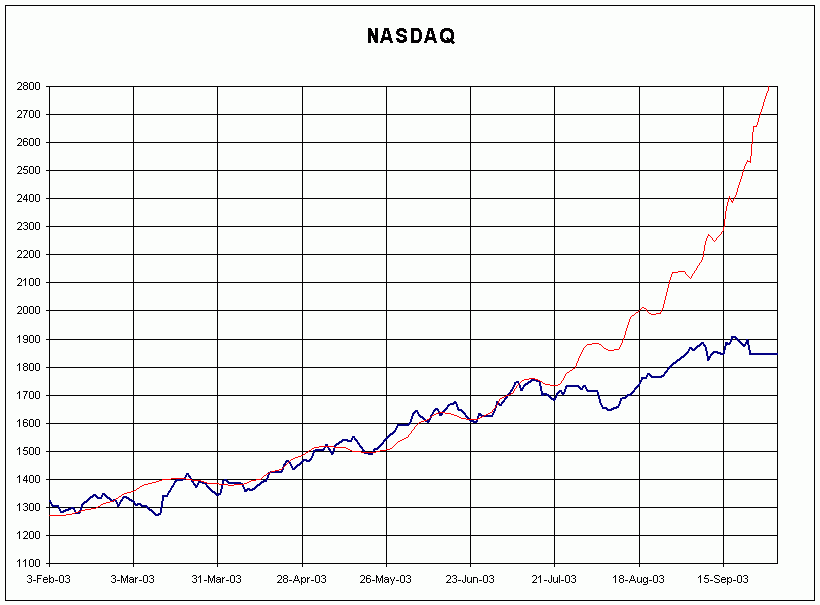
Sep 12 The latest top was Sept 8 corresponding to a blip up on the red model curve. A few days down and then up (for Sept 18??) as the cycles get ever tighter. I'm mostly in cash here, not a place to be overly committed, IMO. Remember Enron?
Aug 29 Many are now calling this an echo bubble. Observe the continued parallel pattern of the model and price data.
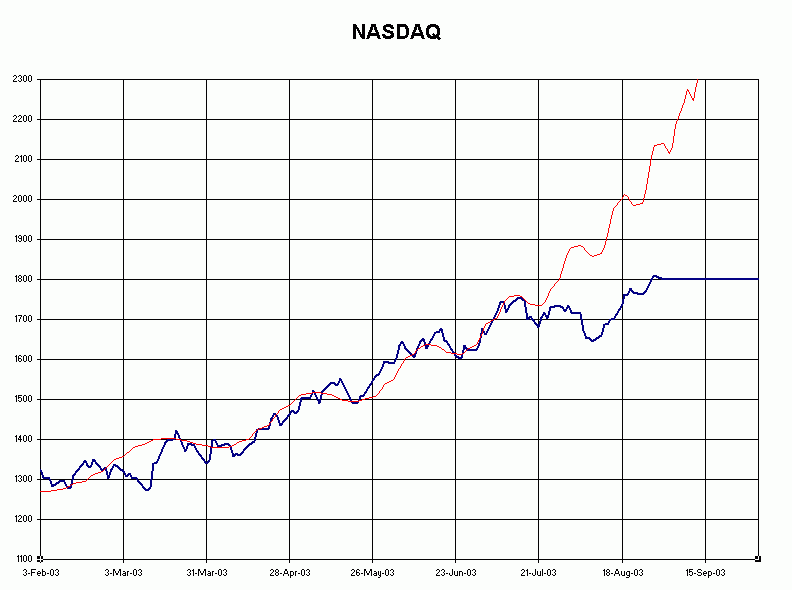
Aug 22 NASDAQ classic Sornette Wave continues up to NASDAQ 1800, as predicted. It is clear the wave is breaking up relative to the earlier pattern. The price data follows parallel to the red model curve with indexes making topping pattern as expected near the August 20 wave top. Expecting intense FED pumping with the arrival of September, perhaps a good time for Bears. :-) Here is the current chart, see below for earlier real time discussion.
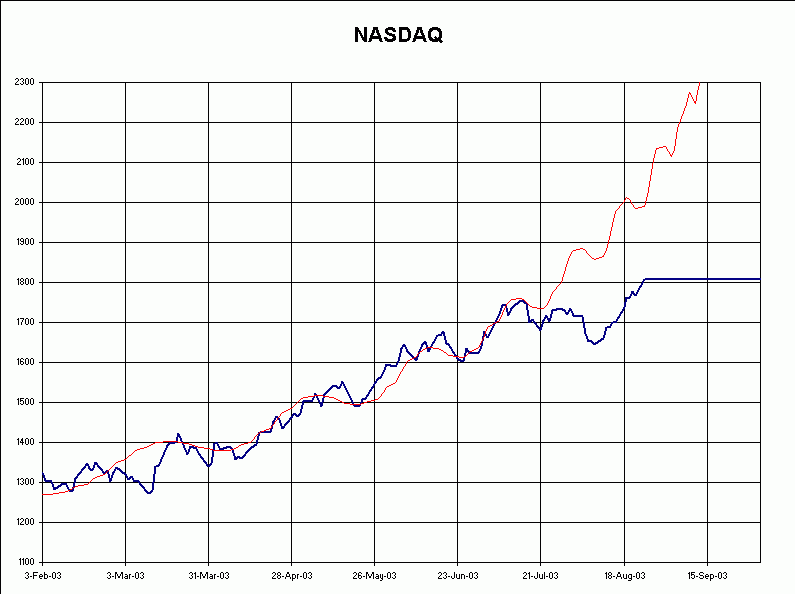
Aug 6 NASDAQ classic Sornette bubble blow-off has fallen from the model curve and as of the 5-th it became very clear indications are time to short. The price curve (black) is on track with the prediction curve (red). The next bottom was due Aug 8 and the next top Aug 20. It will be interesting to see if their ghost continues at lower levels.
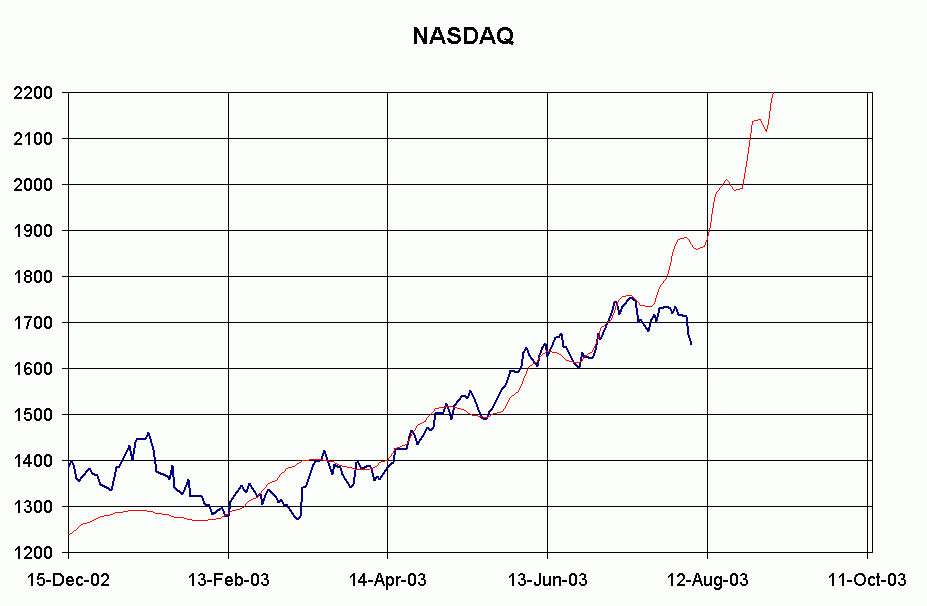
July 14 NASDAQ in classic Sornette bubble blow-off. Major correction/crash warning possible at any time. tc is now moved out from 26-Sep-03 to 21-Oct-03. The next mini-top is 17-Jul-03.
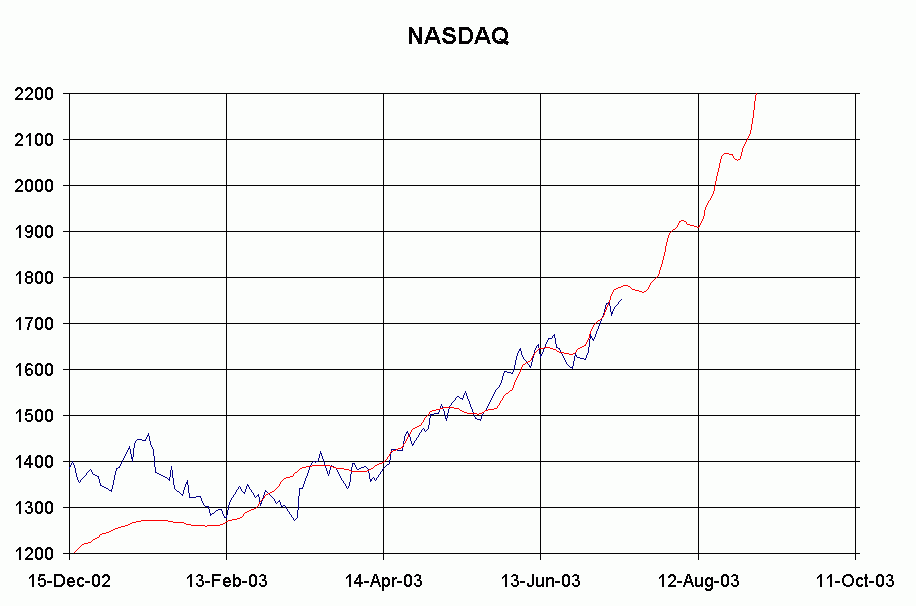
Nailing down the critical time will improve as more time passes. Here is a calculation using tc=30-Dec-03.
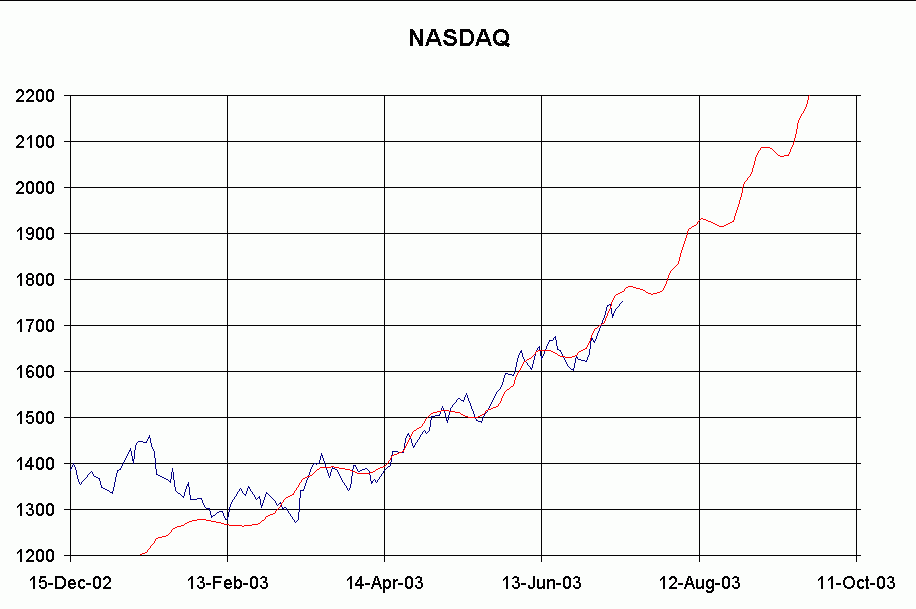
July 3 NASDAQ may be seeing a classic Sornette bubble blow-off here. The curves go infinite in mid-September. Expect something to give before then. Maybe we get one more pump on the NASDAQ to the 1800 level. Then watchout below!
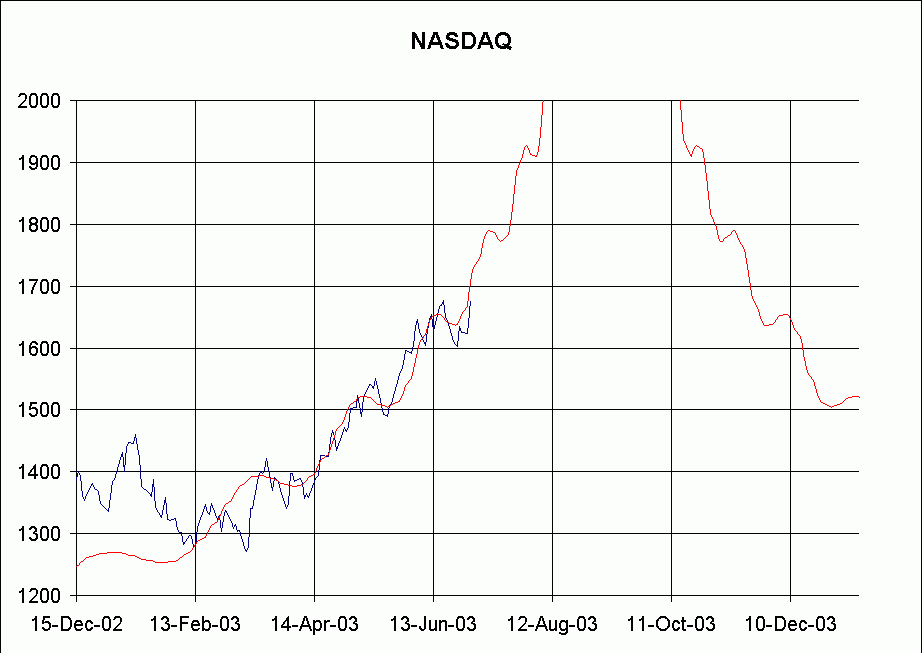
June 17 The first hint of a bubble. Here were my comments in an email:
See attached png file. It is looking like a bubble just about everywhere. :-)
I had noted the NIKK bubble (2000) within a bubble (1990-present) in Sornette's papers. So I looked for a similar NASDAQ bubble in the anti-bubble, beginning last October. My solution showed a mild pointy top this summer, no blow-off. But since Feb 13, it looks like a blow-off possibility. I have stepped aside with longs, this has all the look and feel of 1999. And now, perhaps even the mathematics of 1999.
