dx
1 + x2
It was of interest (to me at least) to fit classic formula to these data and note goodness of fit. The WHO data begins with the 17 MAR 2003 report showing total deaths at 167. A search of news sources reporting earlier SARS death total estimates allowed extending the data back to 15 FEB 2003 when the total was reported at only 4. Even earlier reports from late 2002 may be linked to SARS but these are not included here.
This study finds a good fit to the data where the logistic formula predicts a final total of 816. This is two more than the current total, however the current outbreak has not run yet to completion.
Update, August 15: In Ontario, two more deaths reported, August 11th, a 44-year old woman. And August 14th, Nestor Yanga, a 54-year-old doctor who contracted the respiratory virus in April. This brings the actual total to 816 while the formula has increased its projected total to 820. Mainland China's final two hospitalized SARS patients, Sun Zheng and Lu Zhiyan, released in Beijing. And let's hope that is the end.
Update: Sept 23, 2003: The above numbers were collected in real time from the WHO site. The final totals are revised by WHO, 8098 infected and 774 deaths. Taiwan reduced by about a half the numbers it provided WHO after tests showed many of the cases reported during the February-June outbreak were not SARS.
METHODS. The study of epidemiology uses the Sigmoid Curve to describe the onset and eventual decay of a growth cycle. It is a simple asymptotically bounded, monotonically increasing function containing exactly one point of inflection. There are many functions having these properties. Since exponential growth (increase proportional to size) is a basic property of biologic populations, the most often used function is the logistic function:
y |
= |
1
1 + e-x
|
|
dy
dx
|
= |
sech2 x/2
4
|
|
dy
dx
|
= |
1
1 + x2
|
dx 1 + x2 |
= atan x + C |
The constant C
is the total count at the inflection point. The variable x is the scaled time, x = b(t
- t0). Finally after scaling the atan part of the formula by another constant, a, the formula becomes y = a arctan x + C. The unknowns are a, b, t0 and C.
We write the logistic formula in terms of hyberbolic tanh
function, y = a tanh x + C.
DATA: A jump in the data was seen on 26 March that can be accounted for by the difficulties WHO had in identifying early deaths to SARS. "This is an updated report of [31] cases from 16 November 2002 to 28 February 2003 in Guangdong Province." This has been corrected by the addition of 31 cases to the pre 26 March numbers.
RESULTS: Since the four unknown constants in these formula are not simply related to each other they are found using a conjugate gradient search method.
And now, here are the resulting curves.
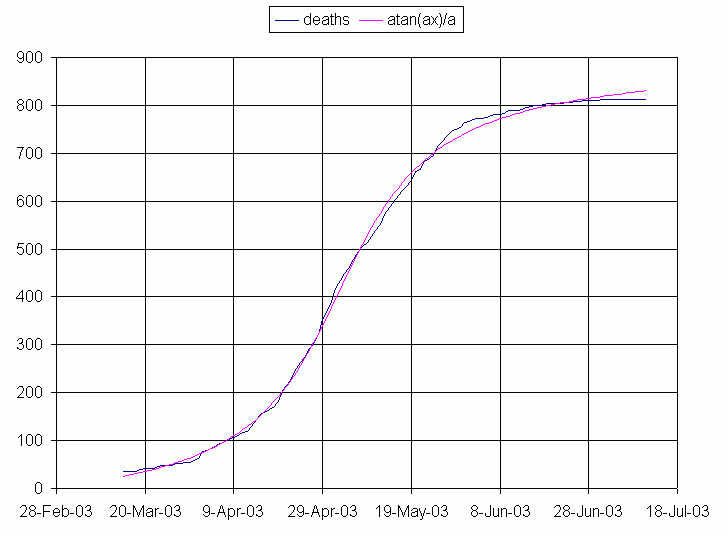
First, SARS cumulative deaths fit to
atan function. Note the data levels off in June but the function continues to increase.

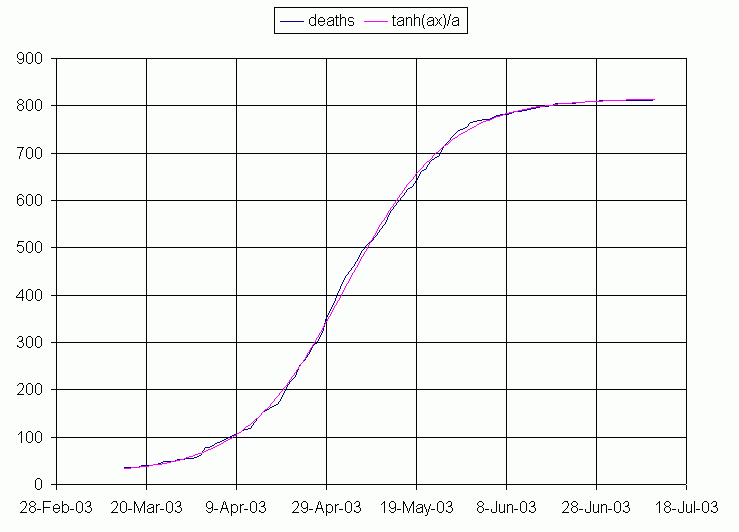
And a better fit to SARS cumulative deaths is obtained using the logistic function, written as tanh.

The inverse tangent formula predicts the final count (putting x large) as ½ (PI) a + C = 900. The logistic formula also predicts the final count (putting x large) in its formula with corresponding constants, a + C = 816. Both the inverse tangent and logistic formulas find the inflection point, t0, to have been May 2. The main differences are in the late curve fit where the logistic formula is surperior.
Taiwan on July 5 became the last place in the world to be declared SARS-free by the World Health Organization, marking the containment of the epidemic. The United Nations agency said July 11 that the syndrome had infected 8,437 people, killing 813.