| QB | RB | WR | K | D | On the left are
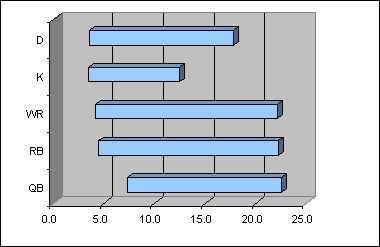
the average points per player at each position. ToDan had best QB Newms had best RB Mitch best WR/TE Newms best Kicker Sausage Bros. had best Defense The chart below shows the typical ranges of points by position. (1 standard deviation for you study squids in the group) |
||
| Ish | 1,792 | 10.9 | 14.3 | 11.6 | 6.8 | 13.4 | |
| Newms | 2,184 | 14.3 | 17.7 | 14.2 | 9.3 | 12.7 | |
| Oms | 1,899 | 12.4 | 15.6 | 14.0 | 7.8 | 6.1 | |
| Pounders | 1,638 | 15.9 | 9.0 | 10.1 | 7.1 | 9.2 | |
| SB | 2,002 | 16.9 | 11.5 | 12.9 | 8.3 | 13.9 | |
| StanLeep | 2,005 | 16.1 | 12.4 | 14.2 | 8.5 | 9.8 | |
| ToDan | 1,771 | 17.4 | 10.4 | 10.8 | 7.5 | 8.7 | |
| Handy | 2,079 | 13.7 | 17.3 | 13.3 | 7.6 | 12.8 | |
| Mitch | 2,176 | 17.1 | 11.9 | 17.3 | 8.8 | 9.4 | |
| AVG | 14.9 | 13.3 | 13.2 | 8.0 | 10.7 | ||
| St Dev | 7.6 | 8.9 | 9.0 | 4.5 | 7.1 |
