| Average Points Per Position Player | |||||||||||||
| Foster | Handy | HB | Ish | Mitch | Newms | OMs | Pounders | Sausage | WarDan | Avg | StDev | Max | |
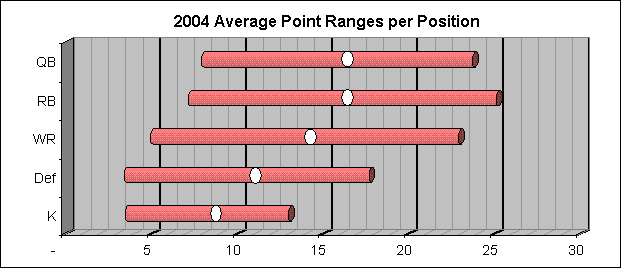
| QB | 20.4 | 15.0 | 13.4 | 16.3 | 14.5 | 16.4 | 14.6 | 12.6 | 15.7 | 19.4 | 15.8 | 7.9 | 41 |
| RB | 9.1 | 14.7 | 14.4 | 16.1 | 16.6 | 21.0 | 18.7 | 17.6 | 18.7 | 14.6 | 16.2 | 9.0 | 47 |
| WR | 12.4 | 12.6 | 14.6 | 14.8 | 16.3 | 12.5 | 12.3 | 15.4 | 13.9 | 14.8 | 13.9 | 9.0 | 53 |
| K | 7.8 | 8.6 | 9.9 | 7.3 | 7.1 | 10.0 | 6.5 | 7.4 | 8.5 | 9.5 | 8.3 | 4.8 | 24 |
| D | 9.3 | 13.1 | 10.2 | 12.7 | 10.8 | 11.3 | 10.6 | 5.4 | 12.4 | 9.9 | 10.6 | 7.1 | 30 |
| Total | 113.4 | 118.8 | 119.5 | 129.2 | 128.9 | 133.7 | 120.5 | 119.4 | 131.4 | 131.8 | 124.7 | 25.1 | 212 |
| best week | 212 | leader | above avg | Click here for Individual Player Stats! | |||||||||
| worst week | 64 | lowest | below avg | ||||||||||
 |
|||||||||||||
 |
|||||||||||||
|
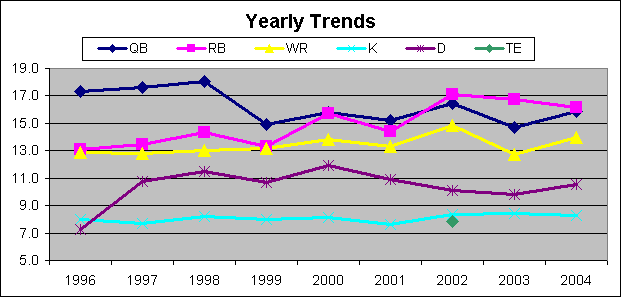
The story with this graph: In 2001 we went from 9 team league to 10 teams, slightly lowering all averages. QB: In 1999, we lowered passing TDs from 6 to 4. 2003 was the lowest year since that change. RB: We haven't changed the points at all, but as running backs increasingly tend to come out of the backfield and receive passes, as well as run, the averages have migrated upward. WR: In 2002, by getting rid of the third WR, the average went up, so the drop in 2003 was expected. Still, the 2003 average was the lowest ever. K: Long field goals (40+ yds) were increased from 5 to 7 a couple of years ago (I think in 2000); still, Kickers are the lowest position in the Leege, although 2003 was the highest ever. Their irrelevance is also exacerbated by the low variance. Defenses: In 1997 I think we added 1 point for sacks, that's why it jumped that year. The addition in 2000 of Kickoff and Punt returns as a Defensive score appears to have had little effect. Defenses was the lowest since 96. TE: Was in 2002 only. |
|||||||||||||
 |
|||||||||||||
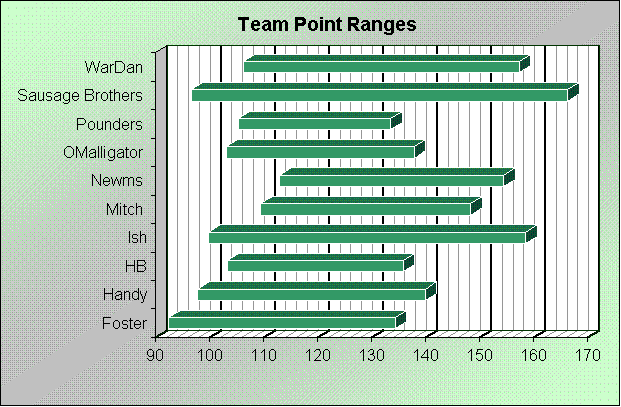
| one standard deviation each way from your average | |||||||||||||