IR - Person Individual Test Result
GA - Group Average
SD - Standard Desviation
 |
Being: IR - Person Individual Test Result GA - Group Average SD - Standard Desviation |
| Z VALUE | CONDITION |
| > 2 | Excellent |
| 1 til 1,99 | Very Good |
| 0 til 0,99 | Good |
| -0,99 til -0,01 | Regular |
| -1 til -1,99 | Poor |
| < 2 | Very Poor |
|
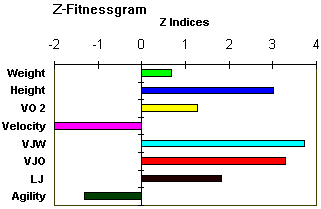
After we've got the Z indices, we'll be able to represent the values in a graphic called Z-Fitnessgram, where is possible to see all physical fitness. Through this graphic, it'll be possible to detect talents by comparing the person graphic with the graphic of an athlete(or an average of a sport). To understand it better look for more examples or ask us clicking on Feedback. |
 |