The computer experiment shows an initially homogeneous population of genomes becoming increasingly heterogeneous. Initially this diversification of the population is caused by point mutations in O- and A-gene regulatory elements (see figure 5).
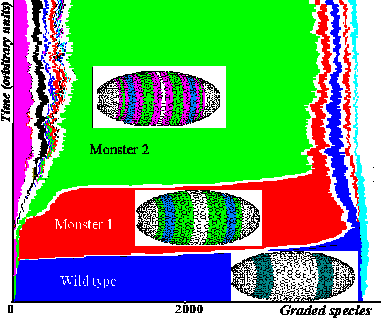
Figure 5. Dynamics of changes in adaptation scores of 4000-genome population presented as a growing "phyletic tree". Each branch is marked by its color. The wider the branch, the more the number of genomes in a given "subpopulation". For the parameter values chosen, evolution achieves a steady state: the wild phenotype remains existing simultaneously with 4- and 8-banded "hopeful monsters". Minority genomes are observed apart from dominant "subpopulations". Pictures of phenotypes that dominated in the population are inserted as small icons.
Time to time, genomes with macromutations will appear (namely, genomes with an extra copy of the initial gene pair).

As discussed above, initial duplication of the O+A gene pair is followed by multiple point mutations in these O' and A' gene regulatory sites. Functionally useless duplicates O' and A' are lost over time with a prescribed probability. However, before this happens, the silent genes accumulate point mutations. With time there appear, by chance, first examples of a genome consisting of four genes, including proper to recruitment of a new gene pair, B + C.

As discussed in the previous section, the silent O' and A' extra copies accumulate point mutations and there is a possibility for shifting the target site specificity compared with the wild-type O and A pair. Only unique combinations of nucleotide substitutions in the silent pair of duplicates allow us to follow recruitment of newly modified genes in the growing cascade:

The sequences and affinities for binding of the products of recruited genes are randomly chosen by the model from the set prescribed before the first run.
The recruiting of new genes via closing of new regulatory pathways really includes step-by-step "handing of steerage" from old an gene-regulator to a new one. Intermediate mutant genes regulated by both regulators represent a bottleneck for evolution of the net. A rare combination of kinetic parameters of gene activation will facilitate passing through the "bottleneck" to a new net structure.
In our computations, for example, the A-gene has three O-binding sites: CCTAAT...CATAAT...AATAAT. In the example discussed, the O-product recognizes the CATAAT sequence family (see Section 4). Hence, the change of the B-gene product recognition specificity to the CAGAAT sequence would be appropriate for subsequent evolution. However, this must coincide also with shifting of the C-gene product specificity to the AGAAT sequence. This sequence is close to the CATAAT family but is not included. I assume that "waking up" of the appropriate B + C pair coincides with appropriate point mutations in the A-gene. There is a very low but finite probability of the triple coincidence.
Thus, the first intermediate mutant has the following A-gene sequence (two "old" binding sites for the O-product and one site for B-binding overlapping with the C-binding site): CCTAAT...CAGAAT...AATAAT. Hence, if one of the target sites mutates in such a way that it becomes a target for concurrent binding of the B and C products, then this yields the next equation for the A-activation:

This mutant has the phenotype shown in figure 6.
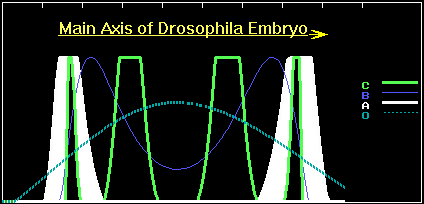
Figure 6. The concentration profiles of the O- , A-, B and C-products in the case of the first appropriate point mutation in the A-gene.
The A-bands of the mutant slightly shifted to termini of the embryo, as compared with the wild phenotype. However, the "monster" additionally expresses a four-wave pattern of C-product expression. If we assume that these deviations in the A-pattern are not too severe for the mutant, then it has a chance for survival and reproduction. Apparently the intermediate forms with a doubly regulated A-gene have weak fitness and will be eliminated by selection. However, if the mutant has selective advantages, say partial tolerance to the virus, then the "intermediates" will accumulate in population. By the way, this reminds us of the well-known case of human sickle-cell anemia. Namely, bearers of the mutant hemoglobin gene suffer from anemia, but are resistant to malaria. As a result, selection led to spreading of the mutant gene among native inhabitants of Africa. Analogously, owing to a slight selective advantage (it has only two targets for the virus insertion against three in wild type), the number of mutants will gradually grow. Sooner or later, a new mutant with two B-binding sites will appear. Its A-gene sequence will be, for example, as follows: CAGAAT...CAGAAT...AATAAT. This "monster" is still slightly defective and it has the phenotype shown in figure 7.
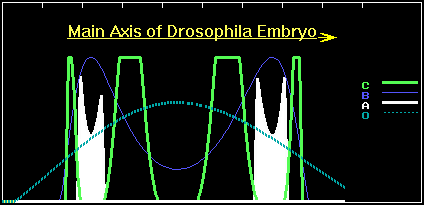
Figure 7. The concentration profiles of the O- , A-, B and C-products in the case of the second appropriate point mutation in the A-gene.
Now the A-bands return to the right location, but profiles of the concentration peaks are slightly changed. However, the "monster" has only one site for virus insertion and probably will leave offspring. In the future, the number of the new double mutants will grow and eventually a complete mutant with absence of the O-binding sites and tolerance to the virus will appear. In our case it will have the A-gene: CAGAAT...CAGAAT...CAGAAT. Selective pressure by the virus favours growth of the number of species with 4-netter cascades and with full absence of the O-binding sites in the A-gene.

The 4-gene cascades escape infection pressure but carry out morphogenesis successfully (the A-product concentration pattern produces the morphology of the wild type). This hopeful monster shows additional four bands of C-expression as compared with the wild type early embryo (see figure 8a and 8b).
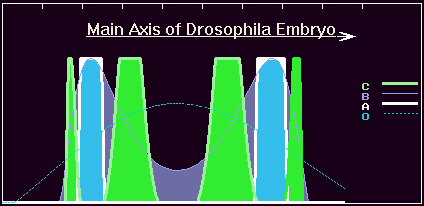
Figure 8a. The concentration profiles of the O- , A-, B and C-products in the case of the third appropriate point mutation in the A-gene.
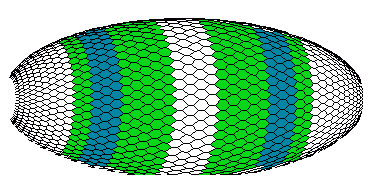
Figure 8b. The view of the early Drosophila embryo with patterns of the A-, B- and C-gene products (computer graphics).
With time, selective advantage of the 4-gene cascade will lead to overgrowth of the mutant population. In parallel, the virus loses its host. Meanwhile silent viruses, in turn, are accumulating mutations and sooner or later a new strain of virus will appear. This new strain will recognize and use B-binding sites in C-genes. As a result, virus sizes match the new host subpopulation, and events will repeat.
Eventually new sort of macromutations (B and C pair duplication) happen.

By analogy with previous steps, the possibility appears for recruiting of new B' + C' duplicates to established 6-netter cascades.
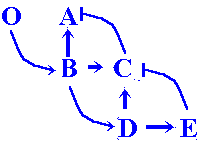
With time the new 6-netter cascade subpopulation mounts. New mutants having a phenotype comparable to the wild one appear, but with a "redundant" 4-wave profile of C-gene expression and an 8-wave E-gene expression pattern (figure 9a).
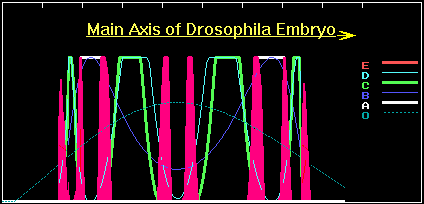
Figure 9a. The concentration profiles of the O- , A-, B-, C-, D- and E-products for 6-gene cascade.
The model phenotypes begin to remind one of a real view of the Drosophila early embryo color plates of gene expression patterns. We at last achieve eight-band patterns (even without strict regularity along the main axis) (figure 9b)
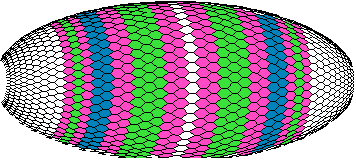
Figure 9b. The view of the early Drosophila embryo with patterns of the A-, B-, C-, D- and E-gene products (computer graphics).
Thus, the cascade down-growth accompanies impressive complication of gene expression pattern from the 2- to the 4- and up to the 8-wave patterns of recruited genes expression. I lay emphasis on the point that the redundant non-selective 4- and 8-band patterns were not a direct goal of my computational evolution. They are a "by-product" of escaping from the "parasite" pressure. However, this "outgrowth" of redundancy of the axial pattern is conditioned by degrees of freedom for variability of the wild type O + A gene pair. Of course, it is not a computational mirror of the real evolution path, but I hope the model catches hold of some essential characters of Reality.