[ german ] [ english ]


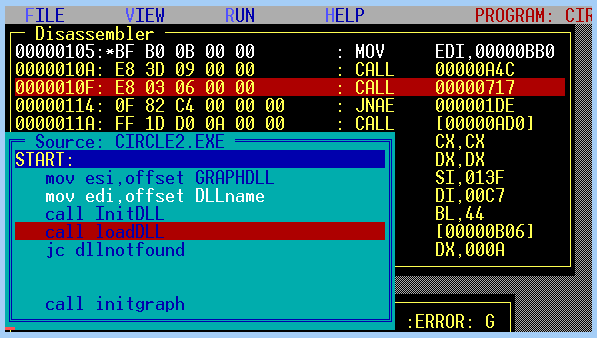
The Pro32 Debugger for analyzing protected mode programs
These are the main features of the 32 bit protected mode debugger:
- load Pro32 programs / load 32 bit binaries
- disassembler function
- display register and selector register contents
- display the FPU registers and status - vga 80x50 mode for good overview
- hex dump function
- watch data types (words, int, double)
- view source code (Pass32)
- trace, step, run and goto function
- set / reset breakpoints
- view exceptions
- interrupt the running program
- reload / restart the program
- program arguments
- Quickhelp for the DPMI API including displaying of the RM Register Table
- store/restore video mode, palette register
- Windows 3.x, Windows '95 and WinNT 4.0 and linux DOS EMU compatible
- full 32 bit support
- sensible exception handler
- absolutely free
What's new with V1.8?
FPU fully supported
VGA 80x50 Text mode
Want to read the read.me file first?:
PRODB.DOC file
For more luxurious protected mode programming: Free Assembler:
Pass32 Assembler
To download the debugger - Click here:
Pro32 Debugger (about 70 KBytes)
Pro32 Debugger

<<<Programming Links>>>
 Software Download Pro32 Debugger (prodb18.zip about 70 KBytes
 Diese Seite deutschsprachig
 Back to Dieter's Home
Dieter Pawelczak, August 1997, March 1998, May 1999, Nov. 1999 


 Software Download Pro32 Debugger (prodb18.zip about 70 KBytes