None
Analog-Digital Converter, this electronic components are used to digitize analogous measuring-signals and make them readable to microprocessors. Depending on the required accuracy the digitizing is performed with 8, 16 or 24 bit resolution.
an important message, sent imediately to the central monitoring system
Dragging is used to move an object on the screen from one location to another. Dragging is also used to resize an object by moving the objects border. Click and hold down the mouse button to move or resize an object.
A focus is a visible border or color-effect emphasizing preselected controls
A filter is used to prevent invalid character-input. The set of valid characters are usually annotated with rectangular brackets, for instance
[0-9], [ASCII 32-127]
Final-Values are the result of the signal-postprocessing. Post-processing is used for data-correction by applying calibration-values, or if the use of different technical units is required for data-evaluation (i.e. ppm versus µg, or m/sec versus km/h).
A Graphical User Interface (GUI) allows the user to interact with the system in a shophisticated way.
Halfhour-Meanvalues (HMV) are the result of the standard data-processing. The environmental monitoring system is capable to store up to 21 days of HMV for up to 48 components.
A component may be a physical or a logical component. For instance the wind-gust is described by 3 logical components: wind-gust, related wind-direction and related time-marking of the occurence.
A progress-bar is an indicator showing the progress of timeconsuming operations
Raw-Values are the result of the signal-conversion - the electrical input-signal is converted in technical units by use of a polynomial. For instance the signal-voltage of the temperature-sensor is converted in °Celsius.
RS-232 is a communication-link used for data-transfer over short distances (suitable for up to 15 meters of cable-length).
The sub-identifier is used to distinguish devices of same type. The unique Device ID consists of two digits describing the type of measuring device (ie. temperature sensor = 13) and a sub ID from 1 - 9.
The task-bar is used by the operating system (ie. Win98, WinNT) to indicate running user-applications. A small part of the task-bar is provided for system-activities, for instance time-display.
A hooverhelp or tooltip is used to explain abbreviations or technical expressions
A User Password is required to access data or execute operations
Variable-Meanvalues (VMV) are the result of user-defined data-processing. VMVs may be established for up to 8 components. The storage of VMVs depends on the number of components and the choosen time-interval.
The environmental monitoring system is capable to store exactly 3 days of VMV for 8 components with measuring-intervals of 1 minute. If the number of components is decreased, or the time-interval is increased, the storage-capacity will increase accordingly.
For detailed information see the W3C homepage at
www.w3.orgNot yet implemented
Uwedat® Servicetool
Data-View
Introduction
The Data-View is provided to examine both the measuring-values and the results of the data-processing. The measuring-values are divided into raw-values and final-values, the results of the data-processing are usually mean-values (
HMV and
VMV), a special cases of data-processing is the recording of extreme-values (ie. wind-gust).
A subsection of the Data-View is the Diagram-View, a comprehensive graphical representation of the data-history and data-development, which supplements the standard tabular data-view. The Data-View is intented for maintenance tasks, therefore the functional scope is kept very simple.
Overview
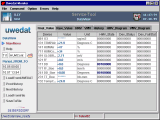
The Data-View consists of a tabbed pane divided into seven display-sections - five tabular dataviews and two graphical dataviews. Click on the overview-list to see a short description to each dataview-section.
View-Modes
 | Raw/Final Values: all measuring-values are displayed and refreshed automatically in periodic intervals (10 seconds) |
 | Mean Values: all measuring-values out of a selected time-period are displayed |
 | Data history: selected measuring-values out of a selected time-period are displayed |
 | Data-Diagram: selected measuring-values out of a selected time-period are rendered as line-graphs |
|
Raw/Final Values
 | Raw Values are the result of the signal-conversion - the electrical input-signal is converted in technical units by use of a polynomial. For instance the signal-voltage of the temperature-sensor is converted into ° Celsius. |
 | Final Values are the result of the signal-postprocessing. Post-processing is used for data-correction by applying calibration-values, or if the use of different technical units is required for data-evaluation (i.e. ppm versus µg, or m/sec versus km/h). |
|
Mean Values
 | Halfhour Mean Values (HMV) are the result of the standard data-processing. The environmental monitoring station is capable to store up to 21 days of HMV for up to 48 components. |
 | Variable Mean Values (VMV) are the result of user-defined data-processing. VMVs may be established for up to 8 components. The storage of VMVs depends on the number of components and the choosen time-interval. The environmental monitoring station is capable to store at minimum 3 days of VMV for 8 components. |
|
Data-History
The Data-History view is provided to examine the development of mean-values of single components.
 | HMVs can be traced back up to 21 days. |
 | The depth of VMV-retrospection depends on the number of components involved and the choosen time-interval between VMV. The range of VMV-retrospection is at least 3 days and at maximum 360 days. |
|
Sorting
The first column of the displayed data determines the initial sorting order of the table. You can re-sort the displayed data by double-click on each of the table-heads. The sorting order changes from ascending order to descending order and vice versa with every subsequent double-click.
|
Diagram-Views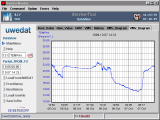
The Diagram-View is the graphical representation of mean-values. Both the HMV and the VMV of selected components are rendered as line-graphs.
|
Menu

The Data-View Menu is used to request the measuring-values from the environmental monitoring station and to archive the data if required on floppy or harddisc.
 Top of document
Raw/Final Values
From a technical point of view, raw-values and final-values are instantaneous measuring-values. They are sampled in determined time-intervals, for instance every 10 seconds - and subsequently they are summarized for averaging. Usually ther is no difference between raw-values and final-values, the following explanation indicates possible exceptions to this rule:
 | Raw-Values are the result of the signal-conversion - the electrical input-signal is converted in technical units by use of a polynomial. For instance the signal-voltage of the temperature-sensor is converted in °Celsius. |
 | Final-Values are the result of the signal-postprocessing. Post-processing is used for data-correction by applying calibration-values, or if the use of different technical units is required for data-evaluation (i.e. ppm versus µg, or m/sec versus km/h). |
Image
Datafields
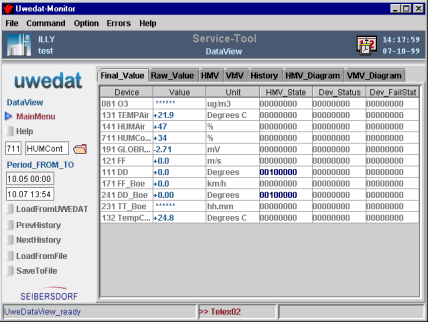
The data-tables for Raw- and Final-Values are divided into six columns. The meaning of the columns are explained by the column-title (see detailed description of the relevant datafields). Each column can be resized individually by
dragging the column-border in horizontal direction.
Each row of the data-table represents a components measuring-value. If the number of components exceeds the size of the table-viewport (the visible area of table-rows) a scrollbar is inserted at the left border of the table.
Meaning
 | Device: The component number and short name of the measuring-component. |
 | Value: The measuring-value. If no measuring-value is available this datafield shows a sequence of asterisks ******. |
 | Unit: The technical unit of the measuring-value. |
 | HMV-State: The availability-qualifier of the measuring-value (see detailed description). |
 | Dev_Status: The operating-status of the measuring-device coded into 8 single bit. The meaning of the status-bit is determined by the relevant device-parameter. |
 | Dev_FailStatus: The error-status of the measuring-device coded into 8 single bit. The meaning of the status-bit is determined by the relevant device-parameter. |
|
HMV-StatusThe HMV-Statusbyte is a qualifier which describes the availability (fitness) of the measuring-value. The meaning of the individual bits is listed below:
Bit 0: No measuring-value available
Bit 1: Measuring-device error
Bit 2: Value out of range (overrange)
Bit 3: Value out of range (underrange)
Bit 4: Calibration in progress
Bit 5: Device idle or maintenance-mode
Bit 6: availability between limits
Bit 7: availability under limit
 |
Example: [21] is equal to 0010 0001, the meaning is
Device idle or maintenance-mode + Measuring-device error
|
|
 Top of document
Mean Values
An important reason for data-averaging is to reduce the number of data-values and to reduce the effects of invalid or poor measuring-values. The environmental monitoring station provides two types of averaging:
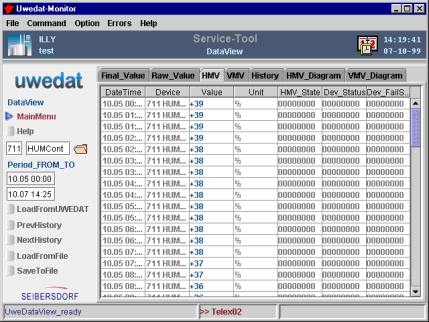
 | Halfhour-Meanvalues (HMV) are the result of the standard data-processing. The environmental monitoring station is capable to store up to 21 days of HMV for up to 48 components. A component may be a physical or a logical component. For instance the wind-gust is described by 3 logical components: wind-gust, related wind-direction and related time-marking of the occurence. |
 | Variable-Meanvalues (VMV) are the result of user-defined data-processing. VMVs may be established for up to 8 components. The storage of VMVs depends on the number of components and the choosen time-interval. The environmental monitoring station is capable to store exactly 3 days of VMV for 8 components with measuring-intervals of 1 minute. If the number of components is decreased, or the time-interval is increased, the storage-capacity will increase accordingly. |
Image
Datafields
The mean-value data-tables are divided into seven columns. The meaning of the columns are explained by the column-title (see detailed description of the relevant datafields). Each column can be resized individually by
dragging the column-border in horizontal direction. Each row of the data-table represents a components measuring-value. If the number of components exceeds the size of the table-viewport (the visible area of table-rows) a scrollbar is inserted at the left border of the table.
The mean-values are organized in sets with same date and time (time-marking). The Previous-button and the Next-button is used to walk through these data-sets.
Meaning
 | Time Date: The time-marking of the meanvalue. |
 | Device: The component number and short name of the measuring-component. |
 | Value: The mean-value. If no mean-value is available this datafield shows a sequence of asterisks ******. |
 | Unit: The technical unit of the mean-value. |
 | HMV-State: The availability-qualifier of the mean-value (see detailed description). |
 | Dev_Status: The operating-status of the measuring-device coded into 8 single bit. The meaning of the status-bit is determined by the relevant device-parameter. |
 | Dev_FailStatus: The error-status of the measuring-device coded into 8 single bit. The meaning of the status-bit is determined by the relevant device-parameter. |
|
HMV-StatusThe HMV-Statusbyte is a qualifier which describes the availability (fitness) of the measuring-value. The meaning of the individual bits is listed below:
Bit 0: No measuring-value available
Bit 1: Measuring-device error
Bit 2: Value out of range (overrange)
Bit 3: Value out of range (underrange)
Bit 4: Calibration in progress
Bit 5: Device idle or maintenance-mode
Bit 6: availability between limits
Bit 7: availability under limit
 |
Example: [21] is equal to 0010 0001, the meaning is
Device idle or maintenance-mode + Measuring-device error
|
|
 Top of document
Data-History
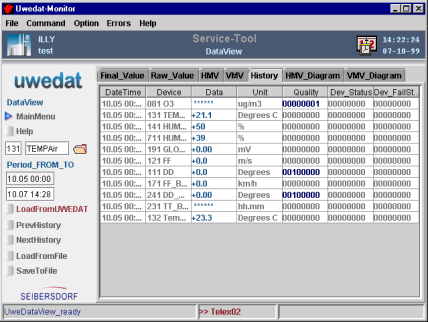
The data-history is a comprehensive report of the mean-values of a selected component. This view is used to examine the development of recorded mean-values in tabular form. Use the Data-View menu to select the component and time-period:
 | HMVs can be traced back up to 21 days. |
 | The depth of VMV-retrospection depends on the number of components involved and the choosen time-interval between VMV. The range of VMV-retrospection is at least 3 days and at maximum 360 days. |
The data-history is organized in sets for each selected component. Use the
Device-Selector to walk through these data-sets. See the preceeding chapter
Mean-Values for detailed information regarding the datafields.
Image
 Top of document
Diagram-View
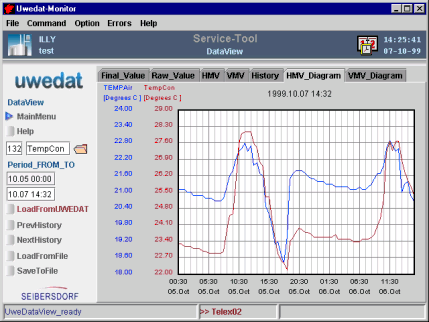
The Diagram-View is the graphical representation of mean-values. Both the HMV and the VMV of selected components are rendered as line-graphs. Use the Data-View menu to specify the time-period. The components are selected by use of the
Device-Selector - a double-click shows the line-graph of the selected component, a subsequent double-click removes the components line-graph.
Auto-scaling is used to fit the graph into the view-area. The graph and the related y-axis are rendered in the same color. Multiple graphs are distinguished by different colors.
Image
 Top of document


 The Data-View consists of a tabbed pane divided into seven display-sections - five tabular dataviews and two graphical dataviews. Click on the overview-list to see a short description to each dataview-section.

 The Data-View Menu is used to request the measuring-values from the environmental monitoring station and to archive the data if required on floppy or harddisc.
