Acid-Base Titrations (Gran Plot)

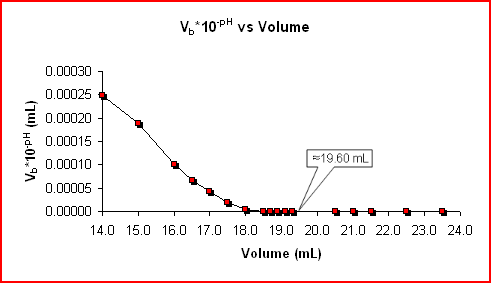
The following data values are based on the sample data displayed on the Acid-Base Titrations (Titration Curve) page. The data is used to graph Vb*10-pH vs Vb.
| Vb (mL) | pH | 10-pH | Vb*10-pH | Vb (mL) | pH | 10-pH | Vb*10-pH |
|---|---|---|---|---|---|---|---|
1.00 |
3.15 |
7.08 x 10⁻⁴ |
7.08 x 10⁻⁴ |
15.00 |
4.90 |
1.26 x 10⁻⁵ |
1.89 x 10⁻⁴ |
2.00 |
3.24 |
5.75 x 10⁻⁴ |
1.15 x 10⁻³ |
16.00 |
5.20 |
6.31 x 10⁻⁶ |
1.01 x 10⁻⁴ |
3.00 |
3.39 |
4.07 x 10⁻⁴ |
1.22 x 10⁻³ |
16.50 |
5.40 |
3.98 x 10⁻⁶ |
6.57 x 10⁻⁵ |
4.00 |
3.54 |
2.88 x 10⁻⁴ |
1.15 x 10⁻³ |
17.00 |
5.60 |
2.51 x 10⁻⁶ |
4.27 x 10⁻⁵ |
5.00 |
3.63 |
2.34 x 10⁻⁴ |
1.17 x 10⁻³ |
17.50 |
5.95 |
1.12 x 10⁻⁶ |
1.96 x 10⁻⁵ |
6.00 |
3.78 |
1.66 x 10⁻⁴ |
9.96 x 10⁻⁴ |
18.00 |
6.60 |
2.51 x 10⁻⁷ |
4.52 x 10⁻⁶ |
7.00 |
3.85 |
1.41 x 10⁻⁴ |
9.89 x 10⁻⁴ |
18.50 |
7.30 |
5.01 x 10⁻⁸ |
9.27 x 10⁻⁷ |
8.00 |
3.98 |
1.05 x 10⁻⁴ |
8.38 x 10⁻⁴ |
18.70 |
7.60 |
2.51 x 10⁻⁸ |
4.70 x 10⁻⁷ |
9.00 |
4.11 |
7.76 x 10⁻⁵ |
6.99 x 10⁻⁴ |
18.90 |
8.15 |
7.08 x 10⁻⁹ |
1.34 x 10⁻⁷ |
10.00 |
4.20 |
6.31 x 10⁻⁵ |
6.31 x 10⁻⁴ |
19.10 |
9.95 |
1.12 x 10⁻¹⁰ |
2.14 x 10⁻⁹ |
10.50 |
4.26 |
5.50 x 10⁻⁵ |
5.77 x 10⁻⁴ |
19.30 |
10.50 |
3.16 x 10⁻¹¹ |
6.10 x 10⁻¹⁰ |
11.00 |
4.31 |
4.90 x 10⁻⁵ |
5.39 x 10⁻⁴ |
20.50 |
10.90 |
1.26 x 10⁻¹¹ |
2.58 x 10⁻¹⁰ |
11.50 |
4.39 |
4.07 x 10⁻⁵ |
4.68 x 10⁻⁴ |
21.00 |
11.80 |
1.58 x 10⁻¹² |
3.33 x 10⁻¹¹ |
12.00 |
4.47 |
3.39 x 10⁻⁵ |
4.07 x 10⁻⁴ |
21.50 |
12.20 |
6.31 x 10⁻¹³ |
1.36 x 10⁻¹¹ |
13.00 |
4.60 |
2.51 x 10⁻⁵ |
3.27 x 10⁻⁴ |
22.50 |
12.30 |
5.01 x 10⁻¹³ |
1.13 x 10⁻¹¹ |
14.00 |
4.75 |
1.78 x 10⁻⁵ |
2.49 x 10⁻⁴ |
23.50 |
12.35 |
4.47 x 10⁻¹³ |
1.05 x 10⁻¹¹ |
A common problem with the graphs of pH vs Titrant Volume, ΔpH/ΔV vs Volume, and Δ(ΔpH/ΔV)/ΔV vs Volume is that the equivalence point is estimated from the graph. A second problem is that the most important data points to analyze are the ones on either side of the equivalence point, but they are the most difficult to accurately obtain.
An advantage to the Gran Plot is that it allows for using the data points before the equivalence point and using linear regression to determine the equivalence point.
The equation for titrating an acid with a base is given by
Vb x 10-pH = Ka*(Vep - Vb)
Vb x 10-pH = Ka*Vep - Ka*Vb
The equation above is of the form y = mx + b, where y = Vb x 10-pH, m = Ka, x = Vb, and b = Vep as shown below.
Note the equivalence point found on the Acid-Base Titrations (Titration Curve) page is in close agreement with the 19.60 mL.
