Civil and
Environmental
Computer
Aided
Design
Free Surface Flow
General Information
Computational Services
Pre- & Post-processing
CECAD-FSF TDF module has the ability of analyzing two dimensional depth-averaged unsteady flow. It can be used to simulate flow in rivers, lakes, estuaries, ports, coast lines and other shallow water areas. This module can also simulate long waves in coastal and ocean domains.
Some good application examples of TDF module are:
- Flow in rivers and channels, considering plan direction and bed topography.
- Flow in channel transitions, sudden opening and sudden closure of channel and river sections.
- Flow around or closed to hydraulic structures in rivers and channels, e.g. bridge piers.
- Flow in estuaries with river (flow) conditions at one boundary and coastal (wave) condition at the other one.
- Flow in lakes and natural reservoirs with several incoming and outgoing river conditions.
- Flow in dam reservoirs with several incoming rivers and outgoing flow conditions.
- Flow in ports and harboures and around jetties in coast lines, estuaries and rivers.
- Flow in seas and coastal areas.
- Flow around intake and outlet areas in coastal zone, estuaries and river domains.
CECAD-FSF TDF module provides the following services:
- Importing data generated by CECAD-FSF MAP module.
- Importing data from CECAD-FF version 1.0.
- Analyzing two dimensional unsteady flow in a shallow water domain.
- Editing data file, using an especial spreadsheet-based editor
- Visualize drawing of computational results.
- Parameter drawing of computational results.
- Animating computational results.
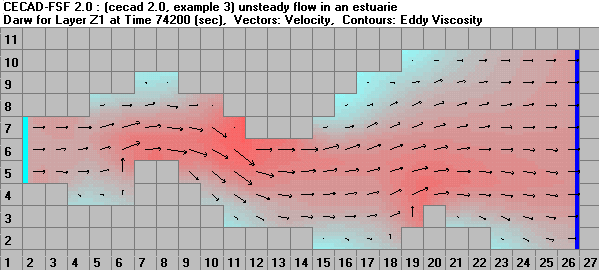
An illustrative example of TDF output is shown in the following picture. It shows velocity profile and eddy viscosity distribution within an estuarine (river boundary at upstream, left side, and tidal boundary at downstream, right side.)
