 | ||||||
| Articles | Projects | Resume | Cartoons | Windsurfing | Paintings | Album |
Analysis of Soils at Royal Roads University
by Waterose et. al.

Section 3. Laboratory Analysis:
3.1 Overview of Laboratory Analysis:
3.2 Soil pH Analysis:
3.3 Sieve Analysis:
3.4 Hydrometer Analysis:
3.5 Permeability Analysis:
3.1 Overview of Laboratory Analysis:
The laboratory analysis was completed over a period of three weeks. The schedule of activites and analysis on the three soil samples is detailed below in Table 1.Table 1. Schedule of Analysis.
| Date | Activity and Analysis | Sample Number |
|---|---|---|
| January 23, 1998 | Collect Field Samples | 1, 2, 3 |
| January 29, 1998 | pH Sieve |
1, 2 1, 2 |
| February 6, 1998 | Hydrometer | 2 |
| February 13, 1998 | Permeability | 3 |
Each phase of the analysis yields specific information to facilitate classification of the soil. The field observations provide landform information, colour analysis and a representation as to the delineation of the soil horizons. The pH analysis provides information regarding the acidity of the soils. The sieve analysis provides information regarding the distribution of the larger particle sizes. The hydrometer analysis provides information regarding the distribution of the finer particle sizes. The combined information from the sieve analysis and the hydrometer analysis provides a total analysis of the distribution of the particle sizes. The permeability analysis provides information regarding the hydraulic conductivity of a soil.
The combined data provides the information to classify the soils under the Canadian Soil Classification taxonomic system.
3.2 Soil pH Analysis:
3.2.1 Introduction:
The analysis of the pH of soils is used to analyse the soil reaction or the hydrogen activity in the soil (Ecosystems, MOE Manual). The soil reaction provides an indication of soil attributes including base status, degree of weathering, amount of leaching, reactions of plant nutrients, and toxicity of plants. The analysis of pH is an important element of soil classification.
3.2.2 Methods and Procedures:
The pH analysis was completed on sample 1 and sample 2 to determine the acidity of the soil samples. The samples were obtained on January 23, 1998 from the locations illustrated in Figure 1: Map of Soil Sample Locations. The samples were returned to the lab to dry for one week; sample 1 was air dried and sample 2 was oven dried. Sample 2 was crushed with a mallet. The pH analysis was completed as follows:- The foreign material was removed from a small dried soil sample and crushed with a spatula.
- The large well in the spot plate was filled with the soil sample.
- Duplex Indicator was added, drop by drop, until the soil was saturated and left to set for one minute.
- The spot plate was tilted to allow the solution to flow into the small well. The colour of the liquid solution was matched to standards on the Duplex Colour Chart and recorded as pH.
3.2.3 Results of the Soil pH Analysis:
The results of the pH analysis are summarised below in Table 2.Table 2. Analysis of pH.
| Sample Number | pH | Colour of Indicator |
|---|---|---|
| 1 | 6.5 | light green |
| 2 | 6.2 | dark yellow green |
3.2.4 Discussion of the Results of the pH Analysis:
This method of pH analysis measures the acidity of the soil solution rather than the pH of the soil. The pH scale ranges from 1 to 14; pH 1 is acidic, pH 14 is alkaline, and, pH 7 is neutral. The pH of both samples is slightly alkaline. Sample 2 is slightly more acidic than sample 1. The results may be similar because both soils probably originate from the same parent materials.
3.3 Sieve Analysis:
3.3.1 Introduction:
The sieve analysis is used to determine the percent by weight of the sizes of the particles. The size of the particles provides information about the environment of deposition. Large heavy particles are deposited in high energy environments and small light particles are deposited in low energy environments. The particle size is used to determine whether the material is classified as a clay, silt, sand, or gravel.
3.3.2 Methods and Procedures:
The sieve analysis was completed on sample 1 and sample 2 to determine the grain sizes of the soil particles in the soil samples. The samples were obtained on January 23, 1998 from the locations illustrated in Figure 1: Map of Soil Sample Locations. The samples were returned to the lab to dry for one week; sample 1 was air dried and sample 2 was oven dried. Sample 2 was crushed with a mallet. The sieve analysis was completed as follows:- Each sieve was weighed to 0.1 gram.
- 500 grams of the coarser (gravel pit) oven dried soil was weighed and broken into smaller particles.
- The sieves were arranged with the largest screen on top and proportionately decreasing screen size to down to the closed-bottom container. The soil sample was placed in the uppermost sieve, covered and shaken lightly, using a back-and-forth motion for for 10 minutes. The mode of shaking was alternated to move the grains continuously across the sieve screens with no definite pattern.
- Each sieve and the pan, with the retained soil was weighed to 0.1 gram. The sum of these retained weights was checked against the original soil weight.
- This procedure was repeated with sample 2 and 500 grams of the finest particles were retained for the Hydrometer analysis.
3.3.3 Results of the Sieve Analysis:
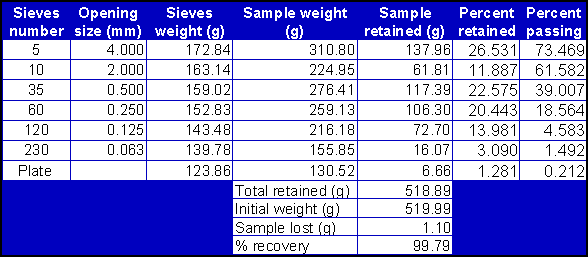
The results for the sieve analysis of sample 1 are contained in Table 3 below.Table 3. Grain Size Analysis of Sample 1.
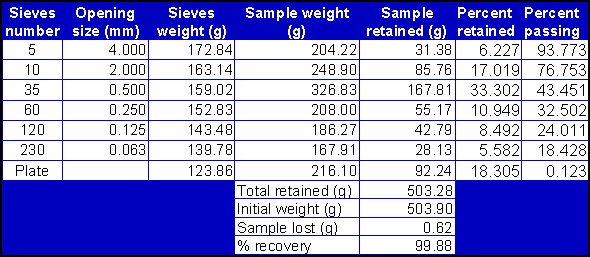
The results for the sieve analysis of sample 2 are contained in Table 4 below.
Table 4. Grain Size Analysis of Sample 2.
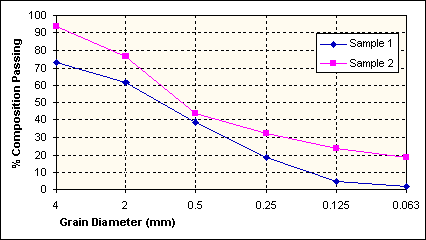
The results of the particle size and percent of particles for sample 1 and sample 2 are plotted on the gradation curves illustrated in Figure 5 below.
The results of the particle size and percent of fine clay and silt particles for sample 2 are treated in the Hydrometer Analysis section.
3.3.4 Discussion of the Results of the Sieve Analysis:
The comparisons of the two types of soil particle compositions are summarised in Table 5 below.Table 5. Summary of Grain Size Types in Sample 1 and Sample 2 by Sieve Analysis.
| Description | Grain Diameter (mm) | Sample 1 Percent Retained | Sample 2 Percent Retained |
|---|---|---|---|
| Gravel | >4.75 | 26.6 | 6.2 |
| Coarse Sand | 0.420 to 4.75 | 34.5 | 50.4 |
| Fine Sand | 0.075 to 0.420 | 34.5 | 19.5 |
| Silt and Clay | < 0.75 | 4.4 | 23.9 |
Sample 1 had a higher percent composition by weight of gravel and coarser materials whereas sample 2 had a higher composition of finer grained materials. Sample 1 is composed of 26.6 percent gravel, 34.5 percent coarse-to-medium sand, 34.5 percent fine sand, and 4.4 percent silt and clay. Sample 2 is composed of 6.2 percent gravel, 50.4 percent coarse-to-fine sand, 19.5 percent fine sand, and 23.9 percent silt and clay. Sample 2 is a typical example of skip-graded soil. Based on the grain-size analysis and the gradation curves, both soil samples do not have good gradation.
This gradation curve is used in foundations and earthworks engineering (Kough, 1969). Soil characteristics can be predicted on the basis of this curve. A good gradation, characterised by a gentle even slope, is representative of a material that is relatively stable. This type of soil is resistant to erosion or scour, can readily be compacted to a very dense condition, and, will develop high shearing resistance and bearing capacity. These characteristics determine the suitability of the soil for certain purposes, such as housing and soil loading capacity. The latter is a critical to avoid landslide and other incidents related to overloading the landform. Moreover, because of the lack of standardisation of the ratio between percent finer and particle diameter scales, the actual slope of any given point can be misleading. Thus, uniformity coefficient is usually used to overcome this problem.
This sieve method of analytical procedure does have some limitations that decrease the accuracy of the results including: soil loss (especially colloid particles), inappropriate mode of sieving, and, insufficient time to allow total sieving so that the soil particles are perfectly sorted.
3.4 Hydrometer Analysis:
3.4.1 Introduction:
The hydrometer analysis is used to determine the percentage of clay in the soil sample. The hydrometer measures the cohesiveness of the soil sample. This is a measure of the ability of the soil particles to "stick" to one another. Hydrometer analysis is a good indicator of the clay content of a soil because the behaviour of the soils’ cohesive portion is very dependent upon the clay content of the soil. Other soil properties including water content, particle sizes, and geologic history also influence the hydrometer analysis but these properties have less impact on the results of the hydrometer analysis.
3.4.2 Methods and Procedures:
The hydrometer analysis was completed on sample 2 to determine the clay percentage of the soil. The sample was obtained on January 23, 1998 from the location illustrated in Figure 1: Map of Soil Sample Locations. The sample was returned to the lab to air dry for one week. The sample was crushed with a mallet and analysed for pH and grain size. Five hundred grams of the sample was sorted by passing it through a series of screens. The soil that passed through the number 230 sieve, a very fine screen, was collected and labelled for the hydrometer analysis. Fifty grams of this soil was mixed with the dispersing (deflocculating) agent sodium hexametaphosphate. The mixture was added to a sedimentation cylinder and topped up with distilled water to a volume of 1000 mL. A control cylinder containing distilled water and deflocculating agent was also tested. This allowed a zero correction to be made which would cancel the effect of the deflocculating agent upon the solution density. Hydrometer and temperature readings were taken at specific time intervals over the next two days.
3.4.3 Results of the Hydrometer Analysis:
The results of the hydrometer analysis are summarised detailed in Table 6 below.Table 6. Grain Size of Sample 2 by Hydrometer Analysis.
| Time (min) | Temp (C) | Hyd (Ra) |
Hyd (Re) |
Percent Finer | Hyd Cor | L | K | D (mm) |
|---|---|---|---|---|---|---|---|---|
| 0.5 | 18.4 | 48 | 42.5 | 84 | 49 | 8.3 | .0138 | .0560 |
| 1.0 | 18.4 | 46 | 41.5 | 82 | 47 | 8.6 | .0138 | .0405 |
| 1.5 | 18.4 | 43 | 37.5 | 74 | 44 | 9.1 | .0138 | .0340 |
| 2.0 | 18.4 | 42 | 36.5 | 72 | 43 | 9.2 | .0138 | .0300 |
| 2.5 | 18.4 | 41 | 35.5 | 70 | 42 | 9.4 | .0138 | .0270 |
| 3.0 | 18.4 | 40 | 34.5 | 68 | 41 | 9.6 | .0138 | .0250 |
| 3.5 | 18.4 | 39 | 33.5 | 66 | 40 | 9.7 | .0138 | .0230 |
| 4.0 | 18.4 | 38 | 32.5 | 64 | 39 | 9.9 | .0138 | .0220 |
| 9.0 | 18.4 | 34 | 28.5 | 56 | 35 | 10.5 | .0138 | .0150 |
| 15.0 | 18.4 | 32 | 26.5 | 52 | 33 | 10.9 | .0138 | .0120 |
| 30.0 | 18.4 | 31 | 25.5 | 50 | 32 | 11.1 | .0138 | .0084 |
| 60.0 | 18.4 | 28 | 22.5 | 45 | 29 | 11.5 | .0138 | .0060 |
| 120.0 | 17.1 | 24 | 18.3 | 34 | 25 | 12.2 | .014 | .0044 |
| 420.0 | 17.1 | 22 | 16.3 | 32 | 23 | 12.5 | .014 | .0077 |
| 1020.0 | 16.0 | 20 | 14.1 | 28 | 21 | 12.9 | .014 | .0016 |
| 1080.0 | 17.1 | 21 | 15.3 | 30 | 22 | 12.7 | .014 | .0015 |
| 1800.0 | 17.5 | 19 | 13.3 | 26 | 20 | 13.0 | .014 | .0012 |
These results are plotted on Figure 6 below.
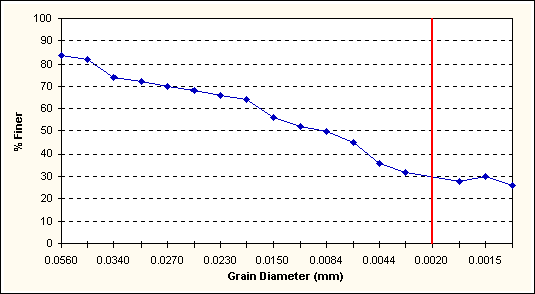
According to the graph of percent finer vs. the log of the grain diameter in mm, the fine grained portion of the soils sample tested contains approximately 75 percent silt (.05 to .002 mm dia) and 25 percent clay (<.002 mm dia).
3.4.4 Discussion of the Results of the Hydrometer Analysis:
Analysis of the graph of percent finer vs. the log of the diameter size yields sample results of 75 percent silt and 25 percent clay. These percentages are approximations. Also, there are certain assumptions that are made when calculating Stokes equation. These include: no interference of particles by other particles or by the walls of the cylinder, all particles are spherical, and known specific gravity of the particles.The first of these errors was eliminated by using only 50 grams of sample in the cylinder; however, experimental evidence indicates that hydrometer readings tend to yield diameter results that are smaller than their true value.
3.5 Permeability Analysis:
3.5.1 Introduction:
The permeability of a soil is a measure of the soils hydraulic conductivity or the ease that water will pass through the soil when exposed to a pressure gradient. Permeability is a very important soil property during groundwater study. It determines the rate at which water will migrate through an aquifer towards well heads. This information is necessary for setting well output rates to prevent draw-down and aquifer depletion. It is also essential for remediating contaminated groundwater. Soil permeability is important whenever projects involve water migration through soils. Projects such as reservoirs, dams, landfills and nuclear waste disposal sites all have a permeability factor that affects their design. Generally speaking the coarser the soil particles, the higher the permeability and the faster the flow. Thus coarse sands have a high permeability and fine grained silts and clays have a very low permeability.It is impossible to duplicate field conditions within the lab and the experiment to determine soil permeability has some built in errors. The soil sample within the apparatus does not exactly duplicate the soil strata in the field. The smooth walls of the chamber do not mirror natural boundary conditions. In the lab, the hydraulic gradient is vertical whereas in the field, it can be horizontal. The hydraulic head applied in the lab may not be the same as that present in the field. However, lab experiments of this type do provide an adequate approximation of permeability provided that certain conditions are met. The flow rate, hydraulic head, and soil volume must all be constant and the soil must be saturated.
3.5.2 Methods and Procedures:
The permeability experiment was completed on sample 3 which was obtained on January 23, 1998 from the location identified in Figure 1 Map of Soil Sample Locations. The sample that was tested for permeability was different than that tested for pH, grain size and the hydrometer. This sample was collected from a roadside and was labelled "Middle sample, Permeability test". The collection site was approximately 5 meters from the side of a gravel road. The site was located on a slope of 15 degrees and was covered with small pebbles, pine needles and sparse grass. The cover was removed and a small hole approximately 20 cm deep was dug. The soil was a orange/brown in colour and appeared to consist mainly of fine to medium grained sand. The sample was bagged and labelled and returned to the lab.Soil sample 3 was analysed in the lab using a constant head test. The flow through the sample was extremely slow. In order to accelerate the process, the hydraulic head was raised as high as the tubing permitted and each test was run for 15 minutes only. Channels developed in the soil during the test and the output was in steady slow drips. Apparently this soil was tested by other groups in the lab without difficulty. Problems that arose during this test may have been due to the presence of clay lumps and a non-homogeneous bag of sample soil.
In future, all soils should be mixed thoroughly to avoid this problem and allow good replicate results. A falling head test would be preferable for this type of soil. A higher hydraulic head and a smaller cylinder of soil would also speed up the process.
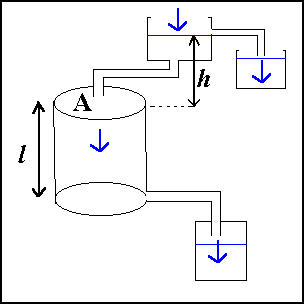
The apparatus is illustrated in Figure 7 below.
3.5.3 Results of the Permeability Analysis:
The results of the volume of water and elapsed time are summarised in Table 7 below.Table 7. The Volume of Output Water "Q" and Elapsed Time for Three Permeability Tests.
| Test Trial No. | Volume of Water (mL) | Time (minutes) |
|---|---|---|
| 1 | 80.0 | 15 |
| 2 | 70.0 | 15 |
| 3 | 52.0 | 15 |
The calculation of the permeability coefficient "k" is detailed in Table 8 below.
Table 8. Calculation of the Permeability Coefficient "k" of the Soil Tested.
| Q (mL/min) | Height of head "h" (cm) | Length of sample "l" (cm) | Cross sectional area "A" (cm2) | Permeability constant k (cm/sec) |
|---|---|---|---|---|
| 67.3 | 32.0 | 13.2 | 31.65 | 0.0128 |
3.5.4 Discussion of the Results of the Permeability Analysis:
The permeability constant for the soil sample tested was calculated to be 0.0128 cm per second. This result indicates that the soil was a sand with some silt content which is consistent with the gross appearance of the sample. The variation in the volume of discharge per 15 minute intervals, prevously detailed in Table 7, could be accounted for by the non-uniformity of the sample. The water channels that were observed within the column could greatly affect the rate of discharge. Thus the permeability constant K that was calculated, has a large error component.
To Section 4. Soil Classification:
Index:
- Introduction:
- Field Sampling:
- Laboratory Analysis:
- Soil Classification:
- References:
- Postscript:
- Tables and Figures

 email Waterose
Please Sign My Guestbook
Please View My Guestbook

| Articles | Projects | Resume | Cartoons | Windsurfing | Paintings | Album |
 | ||||||