 | ||||||
| Articles | Projects | Resume | Cartoons | Windsurfing | Paintings | Album |
Analysis of Soils at Royal Roads University
by Waterose et. al.

Section 3. Laboratory Analysis: Tables and Figures
3.1 Overview of Laboratory Analysis:
Table 1. Schedule of Analysis.| Date | Activity and Analysis | Sample Number |
|---|---|---|
| January 23, 1998 | Collect Field Samples | 1, 2, 3 |
| January 29, 1998 | pH Sieve |
1, 2 1, 2 |
| February 6, 1998 | Hydrometer | 2 |
| February 13, 1998 | Permeability | 3 |
3.2 Soil pH Analysis:
3.2.3 Results of the Soil pH Analysis:
Table 2. Analysis of pH.| Sample Number | pH | Colour of Indicator |
|---|---|---|
| 1 | 6.5 | light green |
| 2 | 6.2 | dark yellow green |
3.3 Sieve Analysis:
3.3.3 Results of the Sieve Analysis:
Table 3. Grain Size Analysis of Sample 1.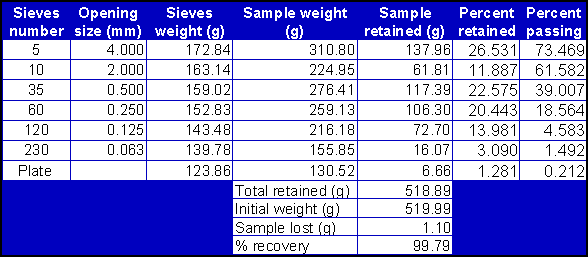
Table 4. Grain Size Analysis of Sample 2.
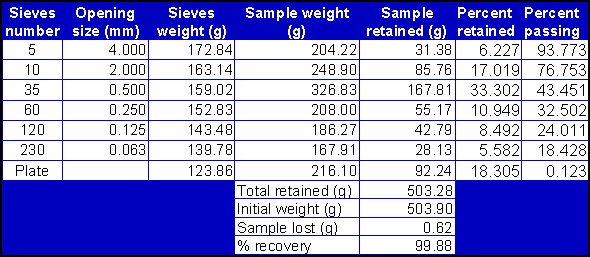
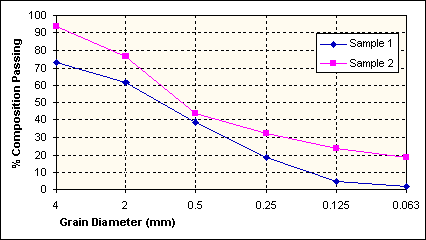
Figure 5. Graph of Grain Size Gradation Curves by Sieve Analysis for Sample 1 and Sample 2.
3.3.4 Discussion of the Results of the Sieve Analysis:
Table 5. Summary of Grain Size Types in Sample 1 and Sample 2 by Sieve Analysis.| Description | Grain Diameter (mm) | Sample 1 Percent Retained | Sample 2 Percent Retained |
|---|---|---|---|
| Gravel | >4.75 | 26.6 | 6.2 |
| Coarse Sand | 0.420 to 4.75 | 34.5 | 50.4 |
| Fine Sand | 0.075 to 0.420 | 34.5 | 19.5 |
| Silt and Clay | < 0.75 | 4.4 | 23.9 |
3.4 Hydrometer Analysis:
3.4.3 Results of the Hydrometer Analysis:
Table 6. Grain Size of Sample 2 by Hydrometer Analysis.| Time (min) | Temp (C) | Hyd (Ra) |
Hyd (Re) |
Percent Finer | Hyd Cor | L | K | D (mm) |
|---|---|---|---|---|---|---|---|---|
| 0.5 | 18.4 | 48 | 42.5 | 84 | 49 | 8.3 | .0138 | .0560 |
| 1.0 | 18.4 | 46 | 41.5 | 82 | 47 | 8.6 | .0138 | .0405 |
| 1.5 | 18.4 | 43 | 37.5 | 74 | 44 | 9.1 | .0138 | .0340 |
| 2.0 | 18.4 | 42 | 36.5 | 72 | 43 | 9.2 | .0138 | .0300 |
| 2.5 | 18.4 | 41 | 35.5 | 70 | 42 | 9.4 | .0138 | .0270 |
| 3.0 | 18.4 | 40 | 34.5 | 68 | 41 | 9.6 | .0138 | .0250 |
| 3.5 | 18.4 | 39 | 33.5 | 66 | 40 | 9.7 | .0138 | .0230 |
| 4.0 | 18.4 | 38 | 32.5 | 64 | 39 | 9.9 | .0138 | .0220 |
| 9.0 | 18.4 | 34 | 28.5 | 56 | 35 | 10.5 | .0138 | .0150 |
| 15.0 | 18.4 | 32 | 26.5 | 52 | 33 | 10.9 | .0138 | .0120 |
| 30.0 | 18.4 | 31 | 25.5 | 50 | 32 | 11.1 | .0138 | .0084 |
| 60.0 | 18.4 | 28 | 22.5 | 45 | 29 | 11.5 | .0138 | .0060 |
| 120.0 | 17.1 | 24 | 18.3 | 34 | 25 | 12.2 | .014 | .0044 |
| 420.0 | 17.1 | 22 | 16.3 | 32 | 23 | 12.5 | .014 | .0077 |
| 1020.0 | 16.0 | 20 | 14.1 | 28 | 21 | 12.9 | .014 | .0016 |
| 1080.0 | 17.1 | 21 | 15.3 | 30 | 22 | 12.7 | .014 | .0015 |
| 1800.0 | 17.5 | 19 | 13.3 | 26 | 20 | 13.0 | .014 | .0012 |
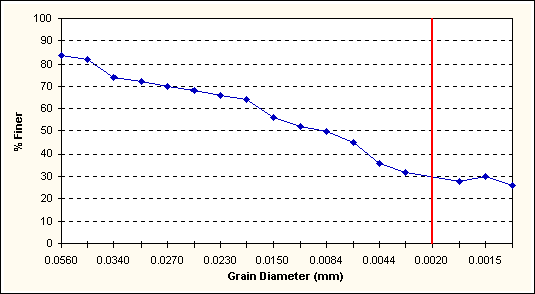
Figure 6. Graph of Grain Size of Sample 2 by Hydrometer Analysis.
3.5 Permeability Analysis:
3.5.2 Methods and Procedures:
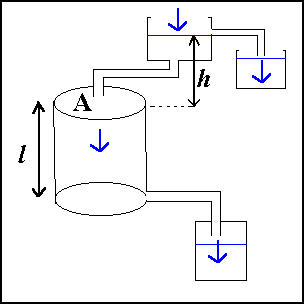
Figure 7. Illustration of the Apparatus for the Permeability Analysis.
3.5.3 Results of the Permeability Analysis:
Table 7. The Volume of Output Water "Q" and Elapsed Time for Three Permeability Tests.| Test Trial No. | Volume of Water (mL) | Time (minutes) |
|---|---|---|
| 1 | 80.0 | 15 |
| 2 | 70.0 | 15 |
| 3 | 52.0 | 15 |
Table 8. Calculation of the Permeability Coefficient "k" of the Soil Tested.
| Q (mL/min) | Height of head "h" (cm) | Length of sample "l" (cm) | Cross sectional area "A" (cm2) | Permeability constant k (cm/sec) |
|---|---|---|---|---|
| 67.3 | 32.0 | 13.2 | 31.65 | 0.0128 |
Index:
- Introduction:
- Field Sampling:
- Laboratory Analysis:
- Soil Classification:
- References:
- Postscript:
- Tables and Figures

 email Waterose
Please Sign My Guestbook
Please View My Guestbook

| Articles | Projects | Resume | Cartoons | Windsurfing | Paintings | Album |
 | ||||||