t =

IMAGE section3267.gif

r

N – 2

IMAGE section3268.gif

1 – r2

(1 – r2

)

r2

IMAGE section3269.gif
IMAGE section3270.gif
IMAGE section3271.gif
IMAGE section3272.gif
IMAGE section396.gif
IMAGE section3271.gif
IMAGE section3275.gif
IMAGE section3276.gif

(N – 2)

F = t2=

Where N = number of pairs of scores

IMAGE section3277.gif
IMAGE section3278.gif
IMAGE section3279.gif
IMAGE section3280.gif

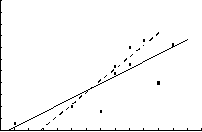
ression lines when height scores (X)are plotted against

ght scores (Y)for ten adult males.

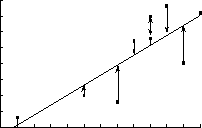
ression line of Y on X showing extent of error(difference

een actual weight score and predicted weight score).

IMAGE section3281.gif

Height (in.) X

IMAGE section3282.gif

140

145

150

155

160

165

170

175

180

185

190

195

61

62

63

64

65

66

67

68

69

70

71

72

73

74

75

X
Height (in.)
70
72
68
66
71
69
73
62
70
69

Y
Weight (pound)
175
160
148
150
178
164
176
143
168
167

Regresion line to
predict Y (Y on X)

Regresion line to
predict X (X on Y)

IMAGE section3283.gif

Height (in.) X

IMAGE section3284.gif

140

145

150

155

160

165

170

175

180

61

62

63

64

65

66

67

68

69

70

71

72

73

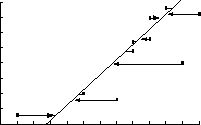
Regression line of X on Y showing extent of error

(difference between actual height score and predicted

height score).

IMAGE section3285.gif

Height (in.) X

IMAGE section3286.gif

140

145

150

155

160

165

170

175

180

61

62

63

64

65

66

67

68

69

70

71

72

73

IMAGE section3287.gif
IMAGE section3288.gif
IMAGE section3289.gif
IMAGE section3290.gif

Transform

In y = In (A) + BX

In y = In(A) + B in(X)

y = A + B (1/X)

1/y = A + BX

1/y = B + A (1/X)

y = AeBX

y = AXB

y = A + (B/X)

y = 1/(A + BX)

y = X/(A + BX)

[made with GoClick]

1