IMAGE section3642.gif
IMAGE section3643.gif
IMAGE section3106.gif
IMAGE section3645.gif
IMAGE section3646.gif
IMAGE section3647.gif
IMAGE section3648.gif
IMAGE section3649.gif

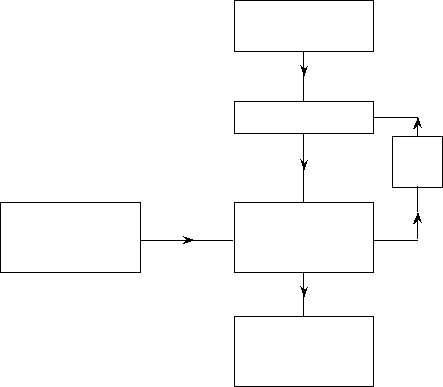
INPUT 1
Statistical distribution for
each component variable.

Select a random value from
each of these distributions.

Calculate the value of system
performance for a system
composed of components
with the values obtained in the
previous step.

Repeat
many
times.

OUTPUT:
Summarize and plot resulting
values of system performance.
This provides an approximation
of the distribution of system
performance.

INPUT 2:
Relationship between
component variables and
system performance.

B >

Name C1

‘RS’

B >

Random 1000 C1;

BC >

Normal 196

3.55.

B >

Name C2

‘CD’

B >

Random 1000 C2;

BC >

Normal 7.492

.371.

B >

Name C3

‘R’

B >

Let C3= C1*50/C2

B >

DESC

C3

MTB >

Histo C3

Histogram of R

N

=

1000

Each* represents 10obs

Midpoint

Count

1100

1

*

1150

8

*

1200

82

********

1250

200

********************

1300

299

******************************

1350

234

************************

1400

124

*************

1450

39

****

1500

10

*

1550

3

*

B >

B >

Desc

C1 - C3

N

Mean

Median

TRMean

StDev

SeMean

1000

195.87

195.67

195.87

3.55

0.11

1000

7.4738

7.4643

7.4721

0.3628

0.0115

1000

1313.4

1311.2

1312.4

67.3

2.1

Min

Max

Q1

Q3

184.43

206.66

193.35

198.42

6.4271

8.5193

7.2322

7.7163

1117.8

1546.2

1268.1

1355.7

neration of systemmoments method:

Mean of R:

R-bar

=

RS-bar * L/ CD-bar

=

196*50 / 7.492

=

1308.1

[made with GoClick]

1